IT Market Snapshot Q3 2020
Welcome!

Welcome in the fourth edition of the IT Market Snapshot report. This time we analyzed nearly 10,000 job offers from the IT sector.
The data that you’ll see on the following pages are optimistic. There is much more job offers, the differences in salaries between cities are blurring and above all, it’s clear that employers have switched to remote work. I’m very pleased that most employers in our sector, have effectively adapt to the surrounding conditions and switched to the effective remote work - which can be seen from the rising indicators that you’ll see in the following pages.
Regardless of whether you’re an employer or a potential candidate, I’m convinced that this reading will be valuable to you!
Assumptions
The report concerns only job offers from broadly understood IT (programming, administration, IT project management, business intelligence, maintenance of IT systems)
Most of the analysis is based on the upper salary ranges because:
- The median salary range (the difference between the upper range and the lower range) for B2B contracts is approx. PLN 5 000, and on average the upper range constitute approx. 145% of the lower range.
- Candidates seeing such a large spread focus their expectations to the upper range - this is the observation from recruitment conducted by our team, as well as the feedback of our clients.
Junior, Mid, Senior – What does it mean?
All job offer portals assume different levels of experience. In the report we use „junior”, „mid” and „senior” after aggregation and consistency of collected data. If there is an „expert” level in job offers it’s combined in our report with the „senior” level. There is, of course, an objective problem distinguishing between them and their boundaries. Different levels of expertise can often appear simultaneously within a single job offer. So we tried as appropriately as possible classify job offers to experience levels.

Executive Summary
All indicators are going up!
Because we use the same sources for each report, we can objectively conclude that Q3 brought increases in almost every aspect. There’s much more offers, salaries have returned to the Q1 report’s levels, the number of employers publishing job offers also increased (which is probably due to the fact that some companies, which so far hadn’t seriously thought about expanding their business online were forced to do that because of the pandemic situation).
Unfortunately, there is no good news for juniors in this quarter neither. The number of offers for the least experienced candidates is almost the same compared to the previous quarter, there are still very few of them.
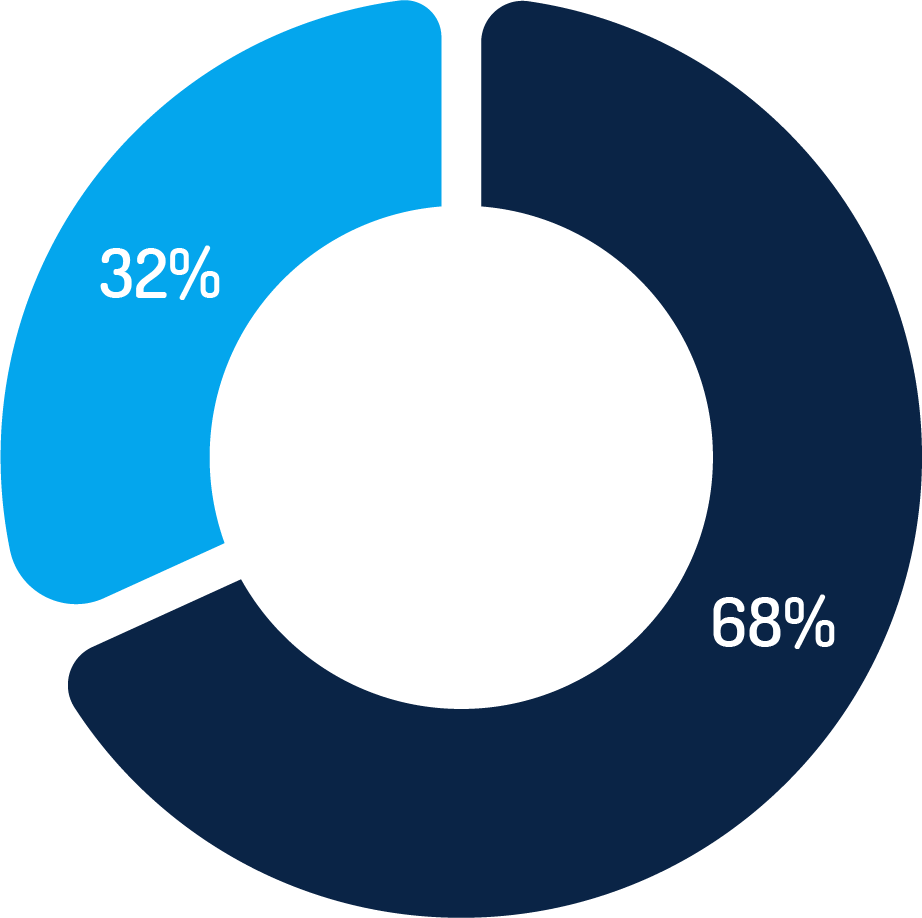
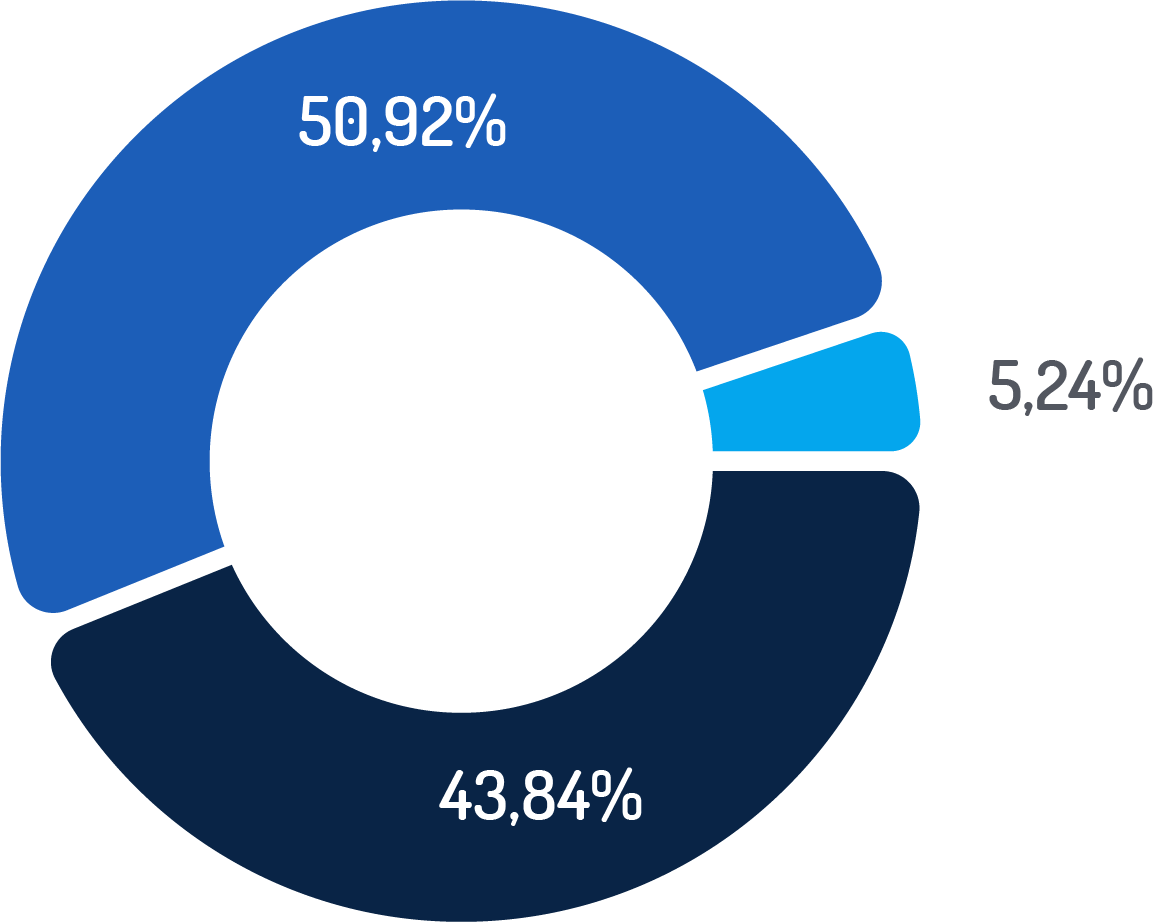
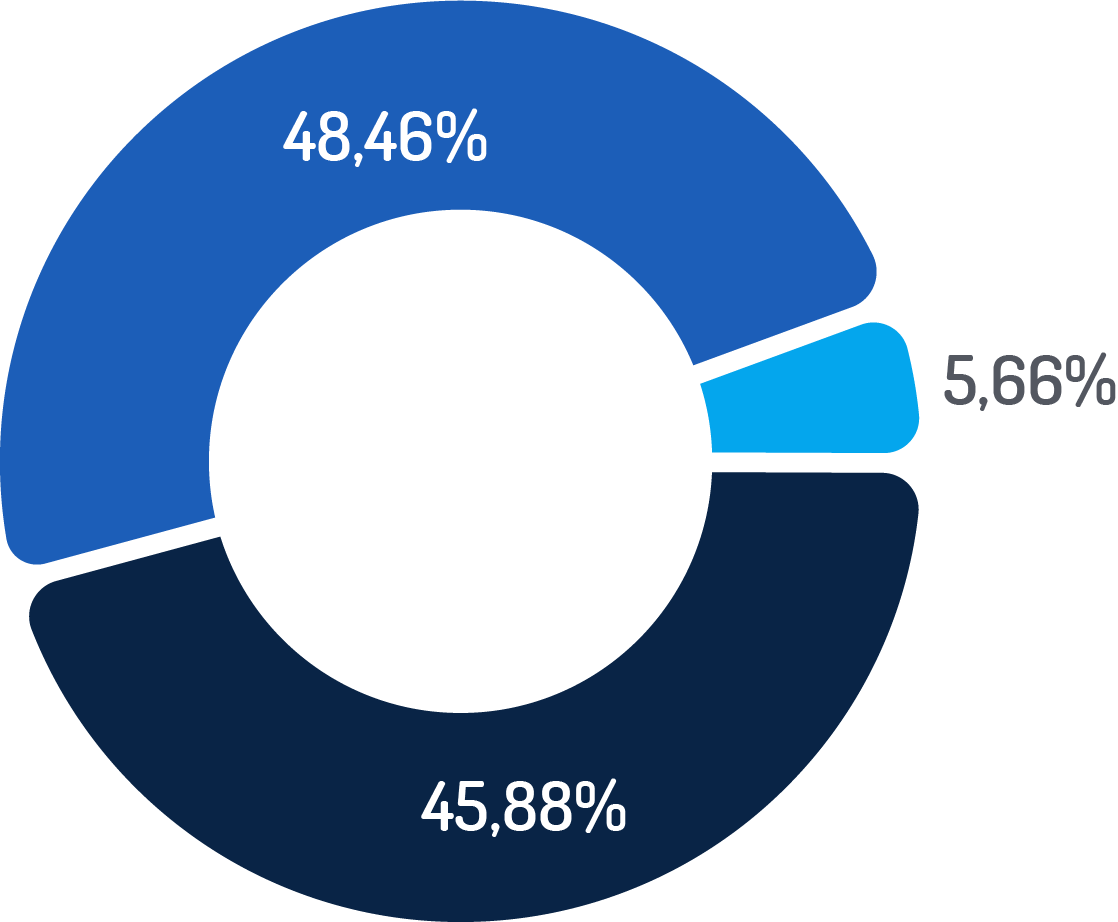
Are salaries included in IT job offers?
In comparison to Q2 absolutely nothing has changed in case of publishing salary.
The percentage of job offers with salary vs job offers without salary is identical and unfortunately, most employers still do not publish salary ranges to candidates.
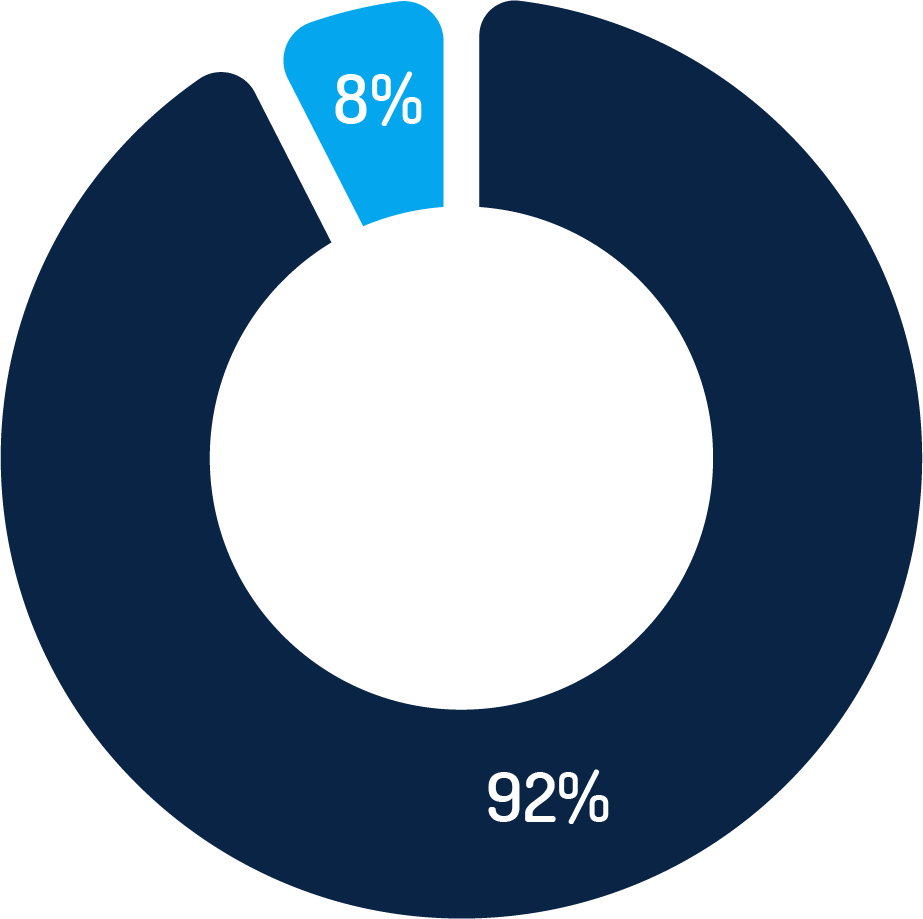
n the case of the market leader, 8% of job offers in the “IT Administration ” and “IT Software Development” have the information about the salary, which is a slight decline compared to the previous quarter in which 10% of job offers had information about salary.
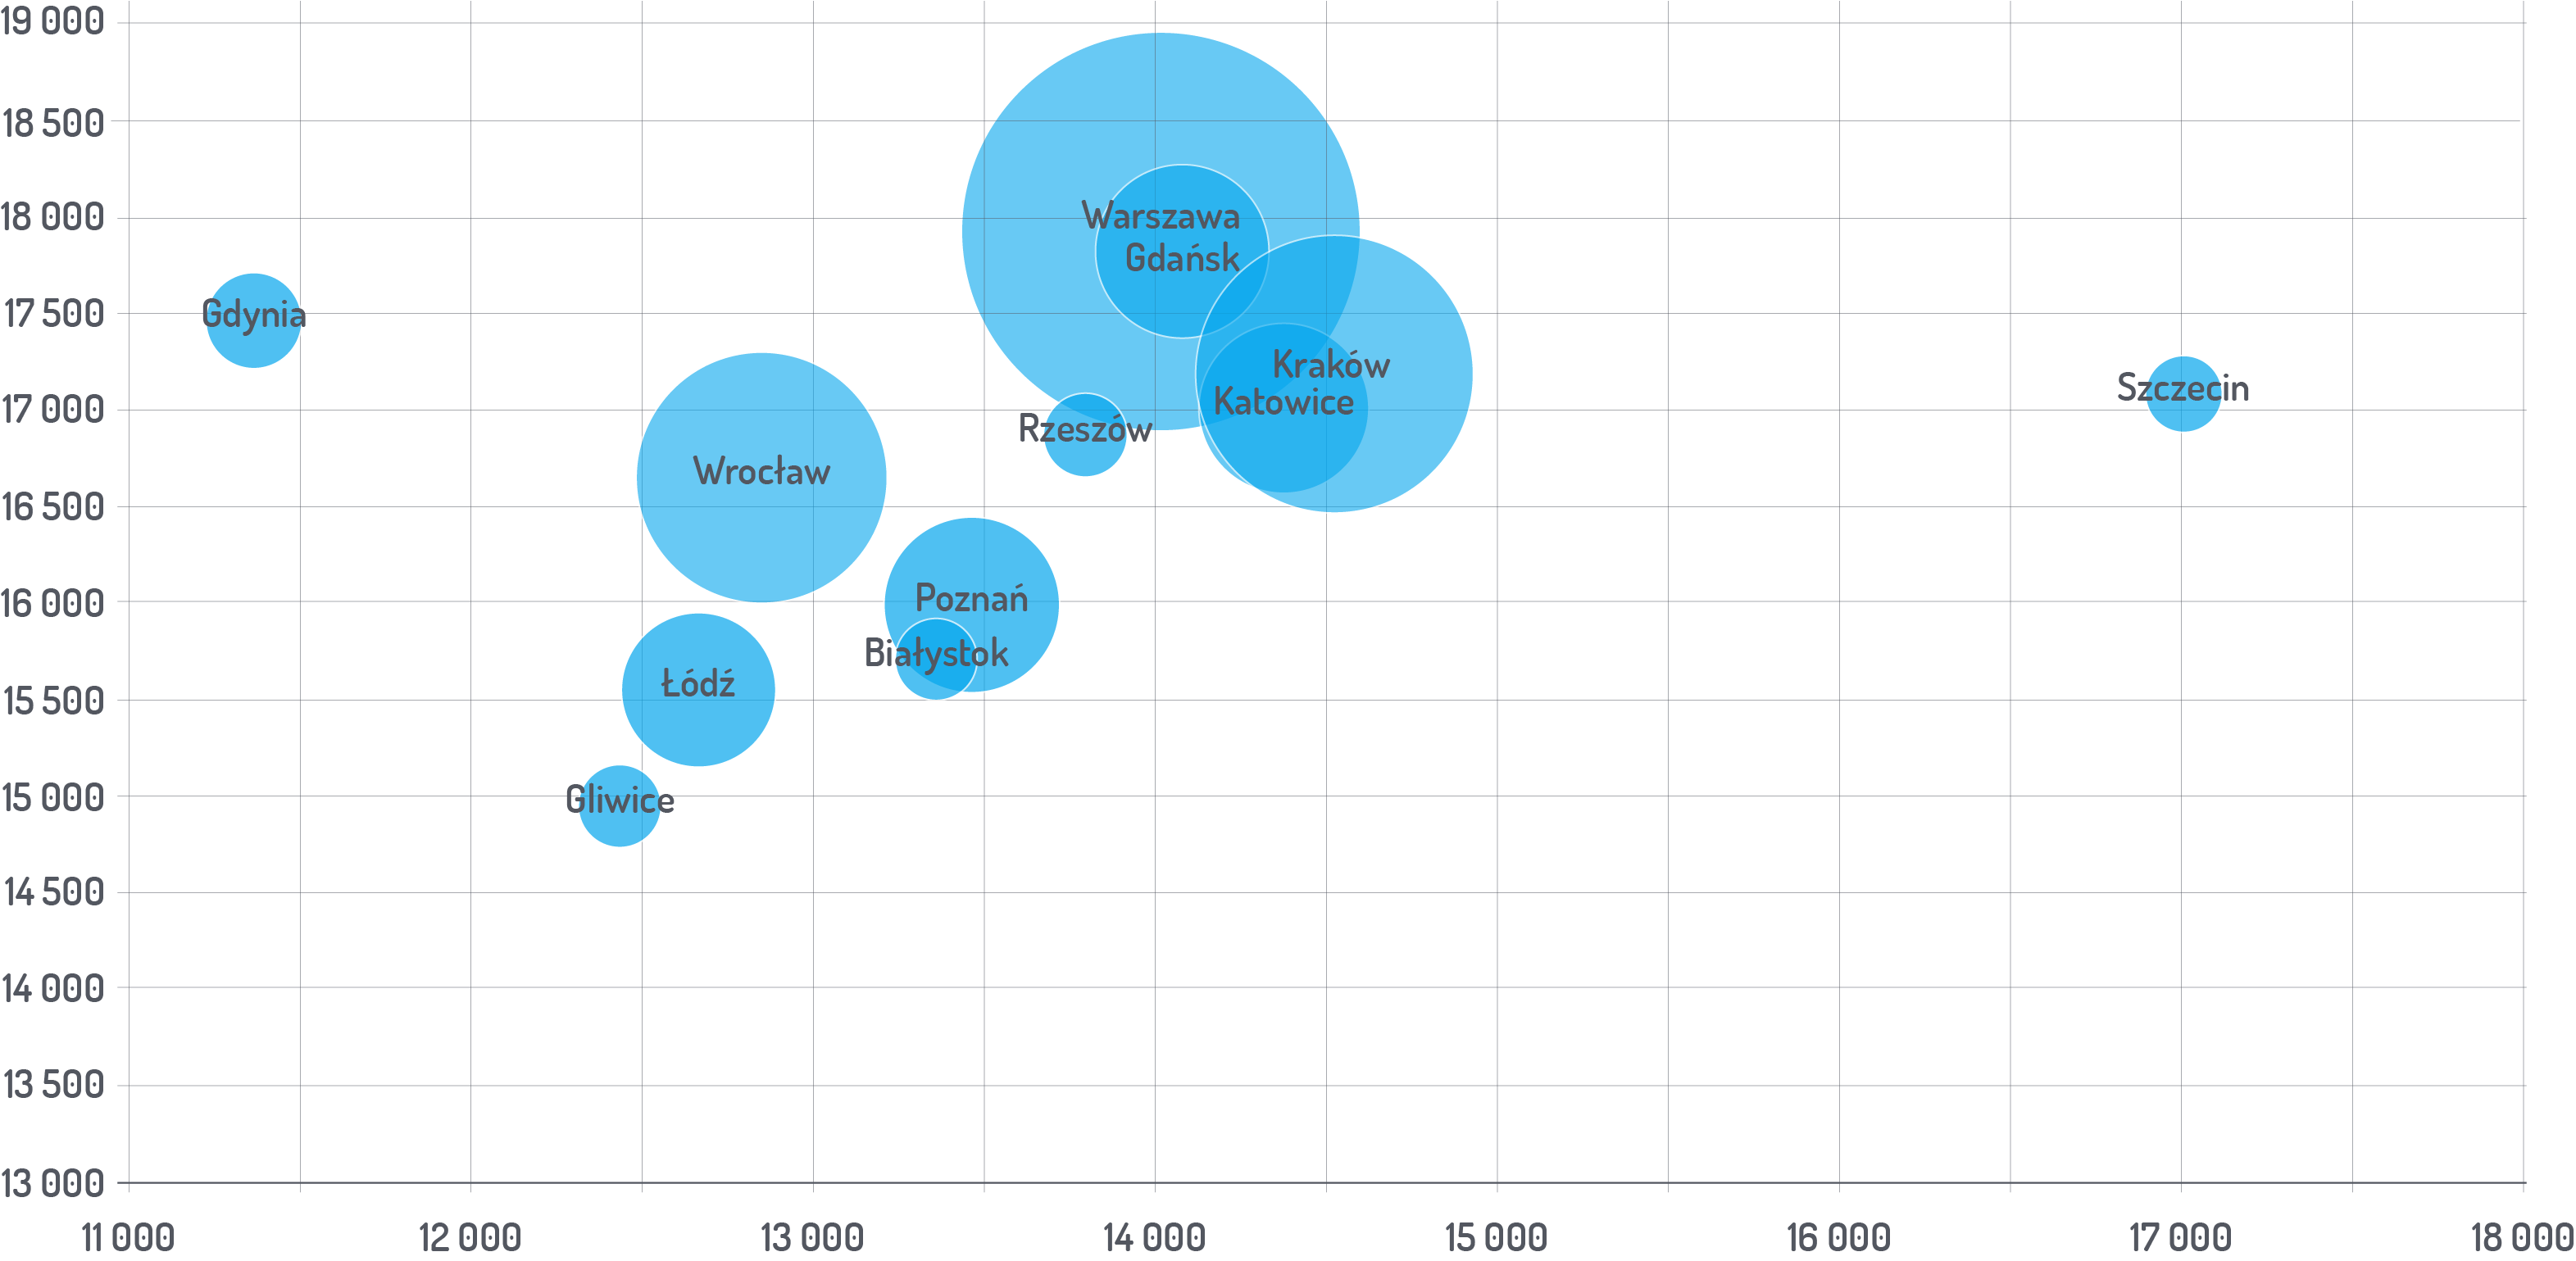
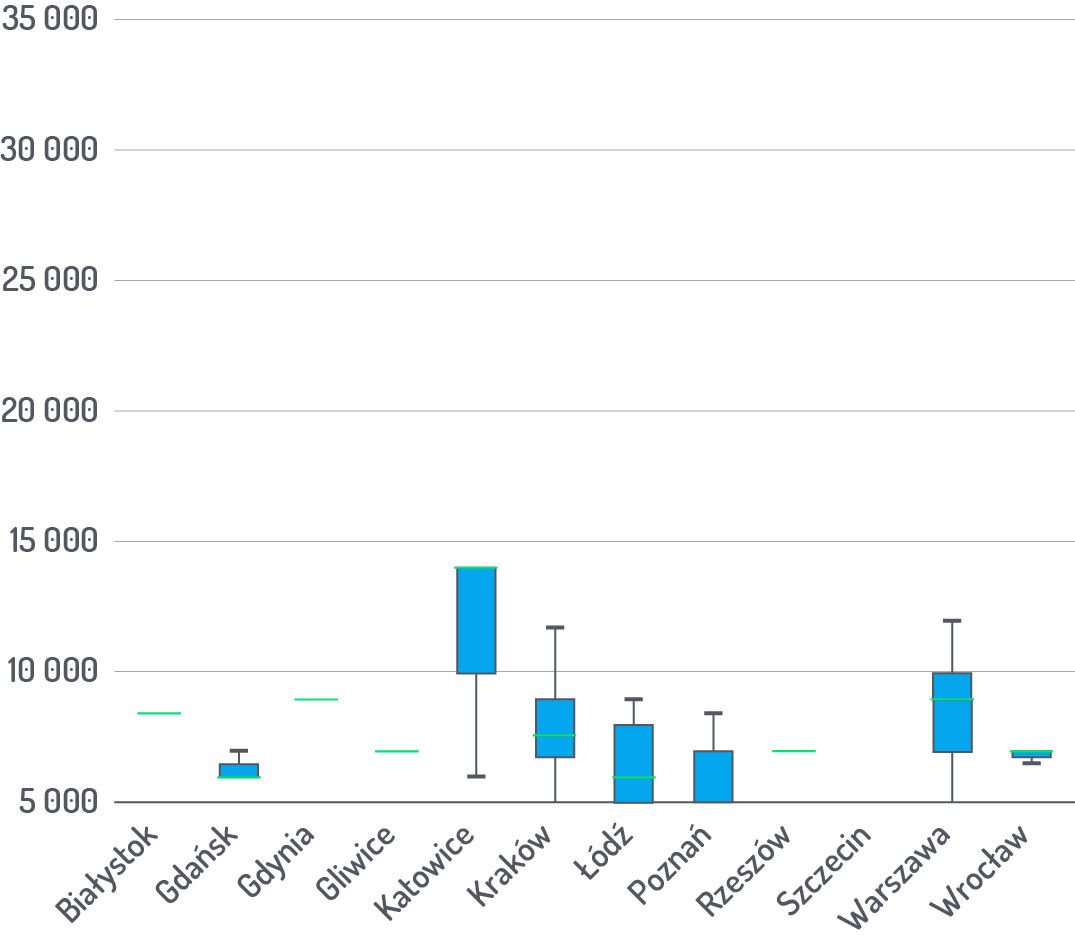
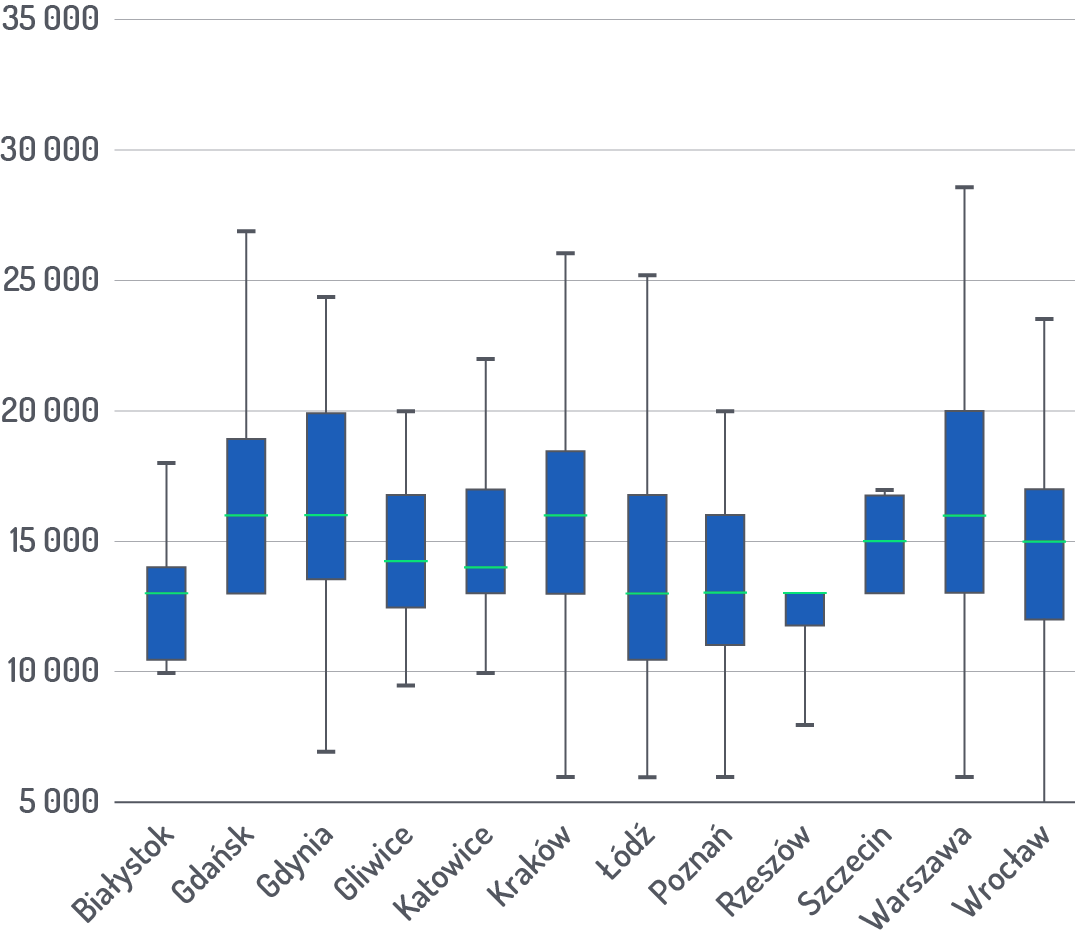
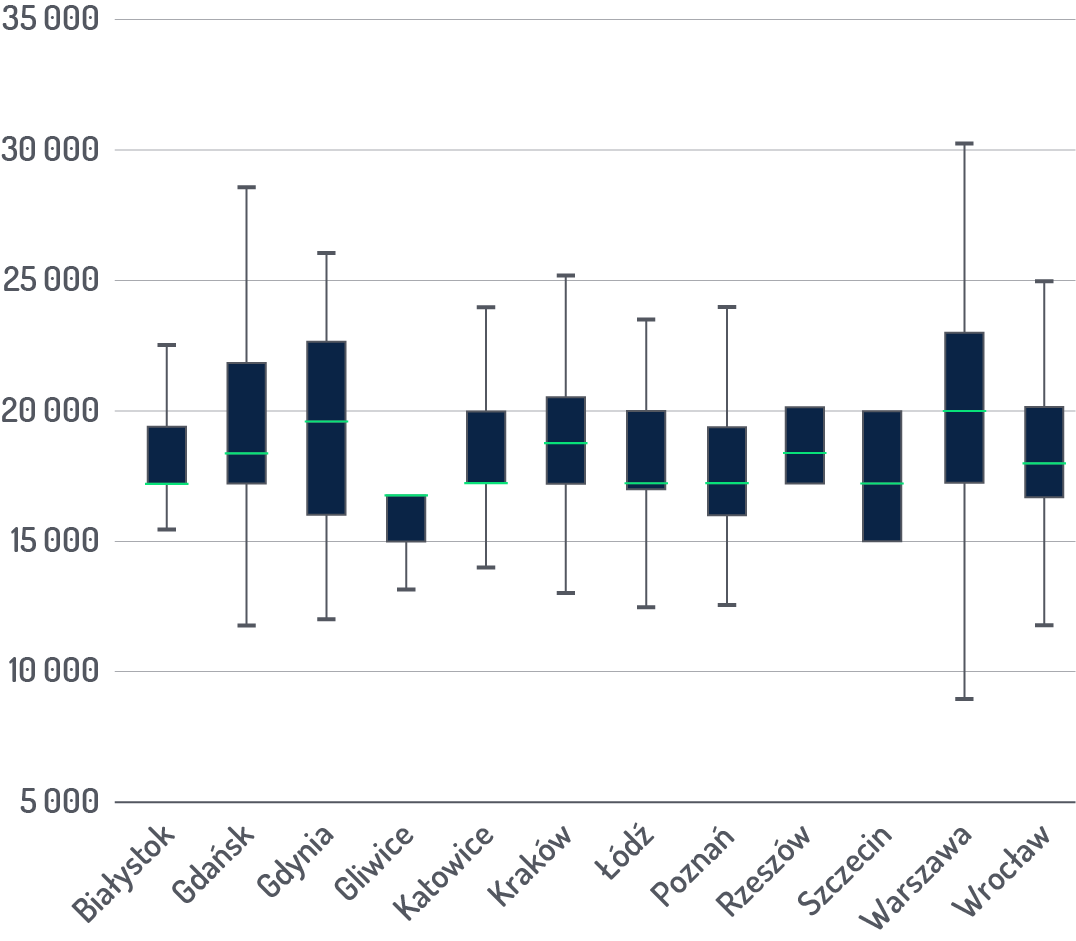
IT announcements in major cities
Distribution of the number of job offers in individual cities
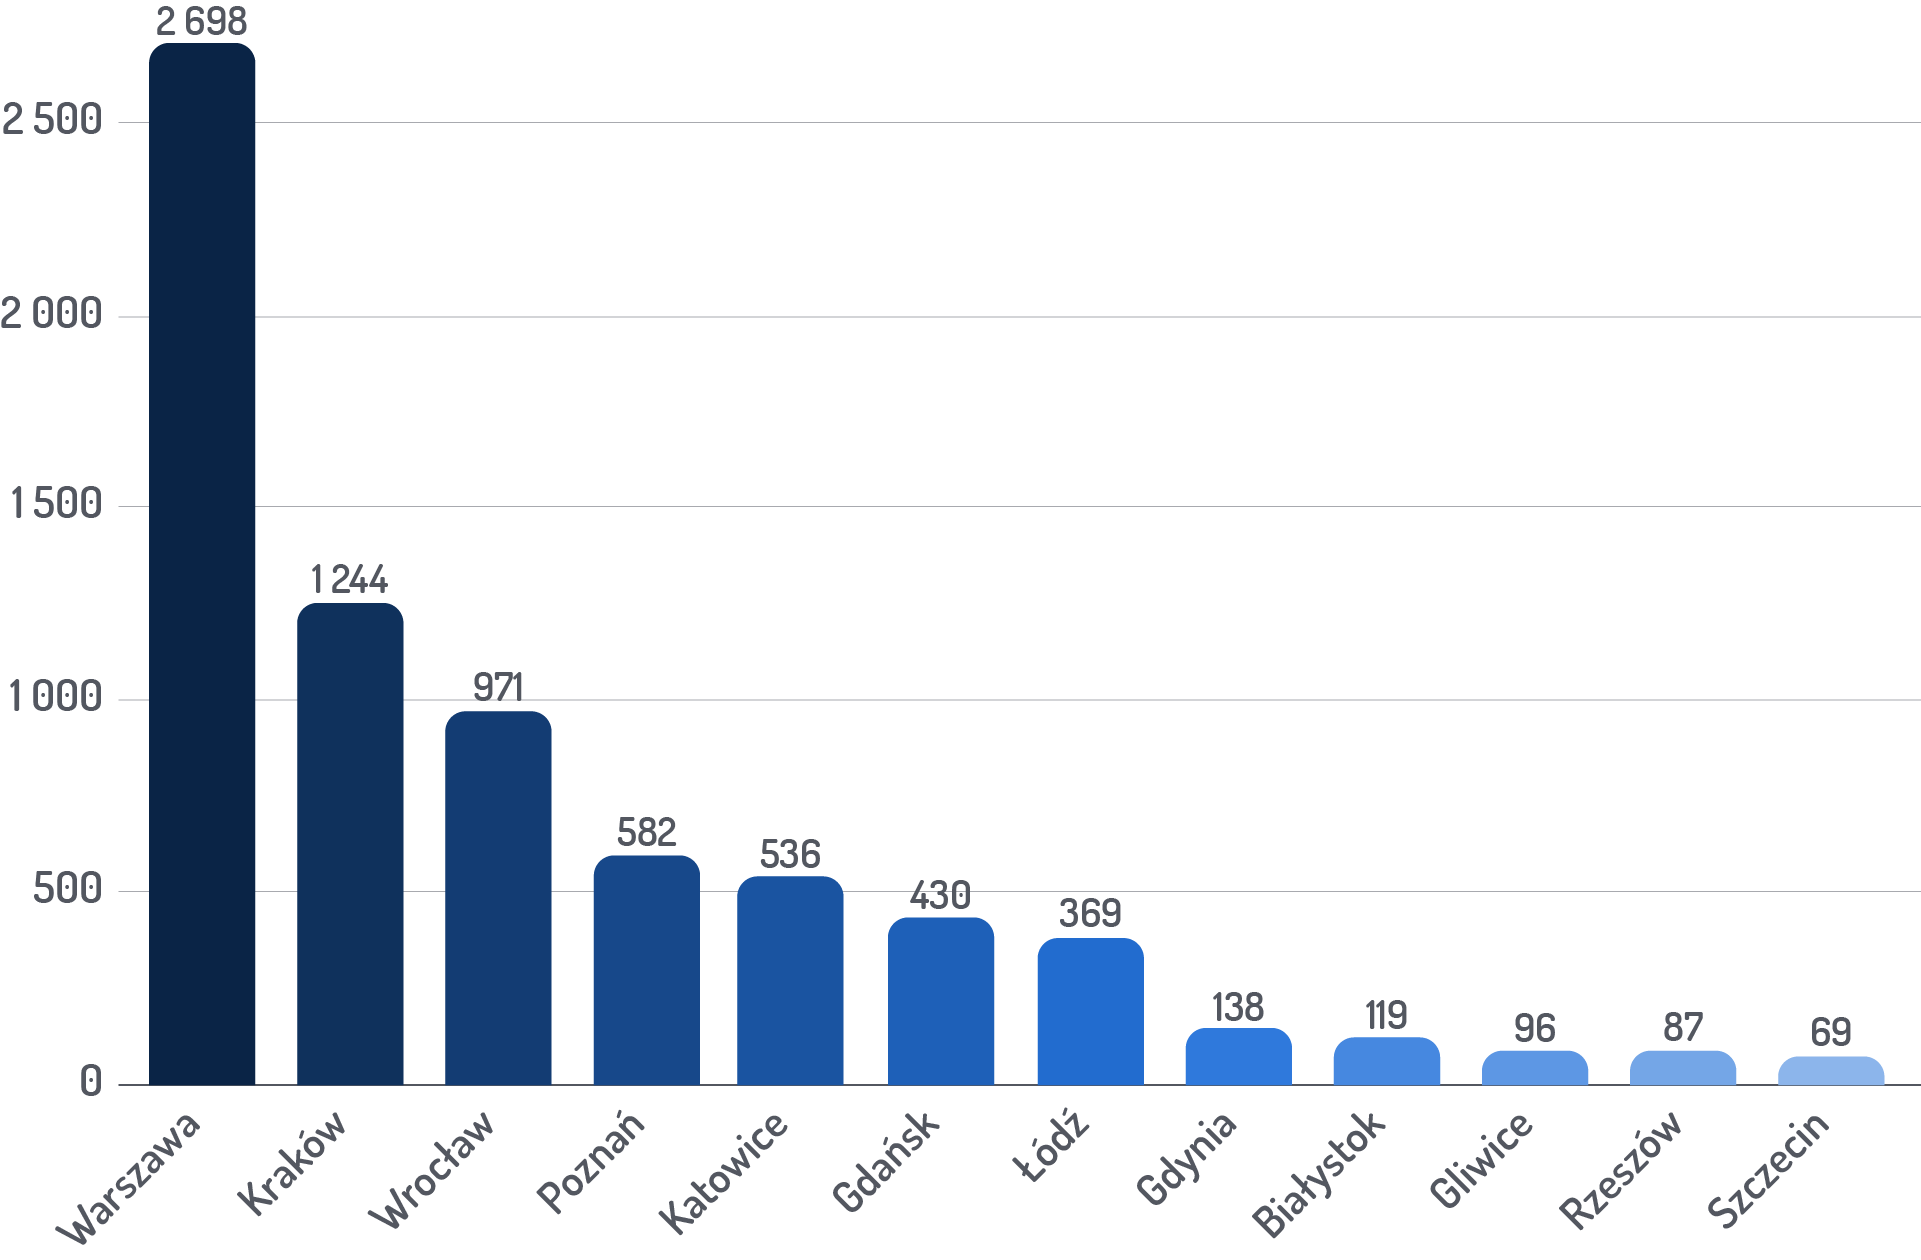
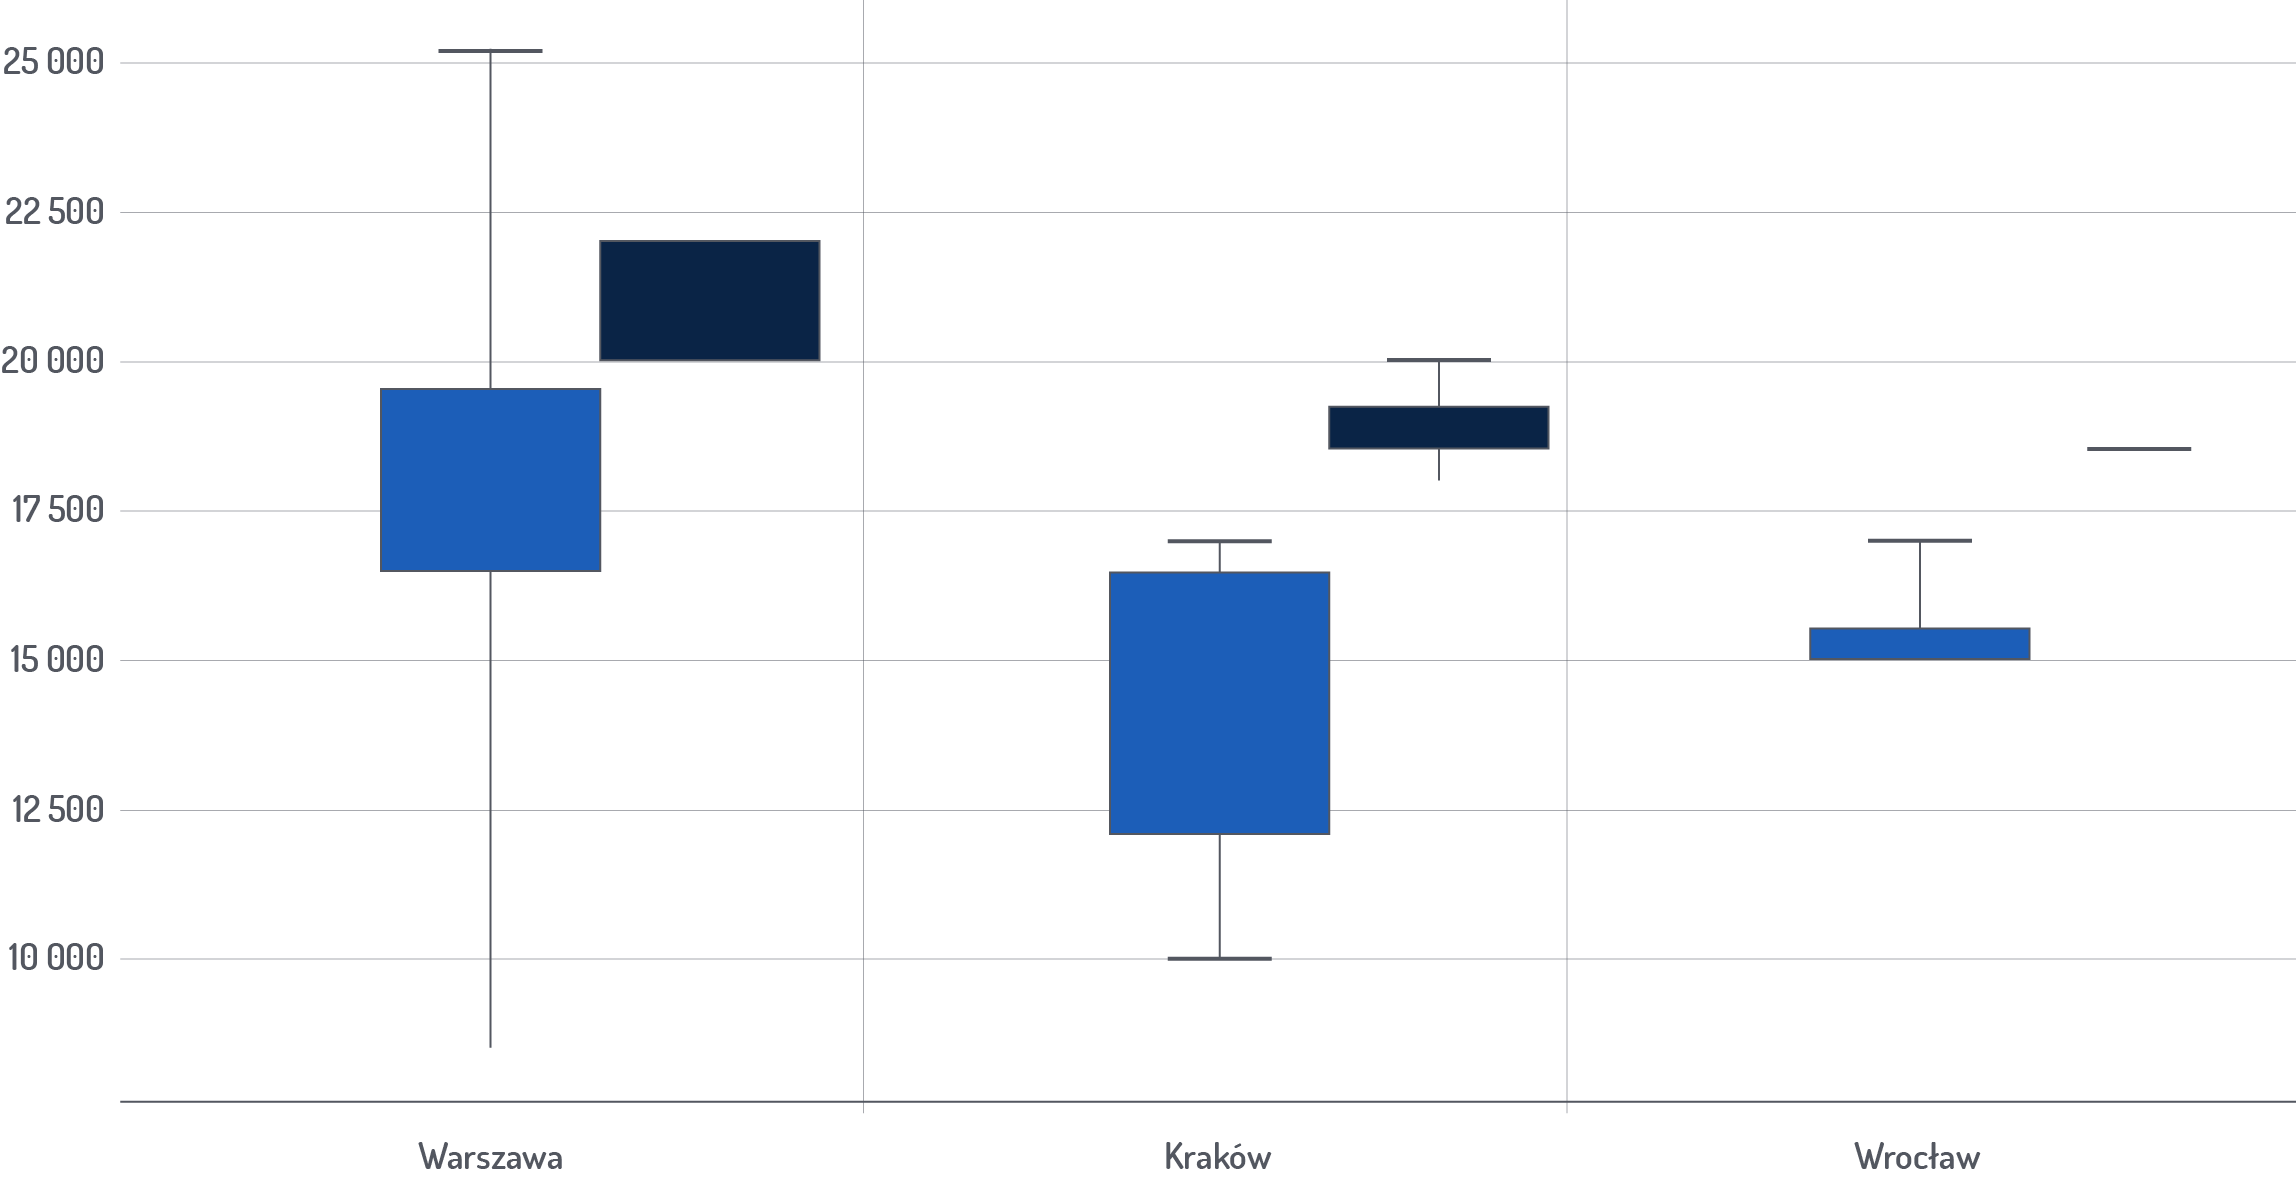
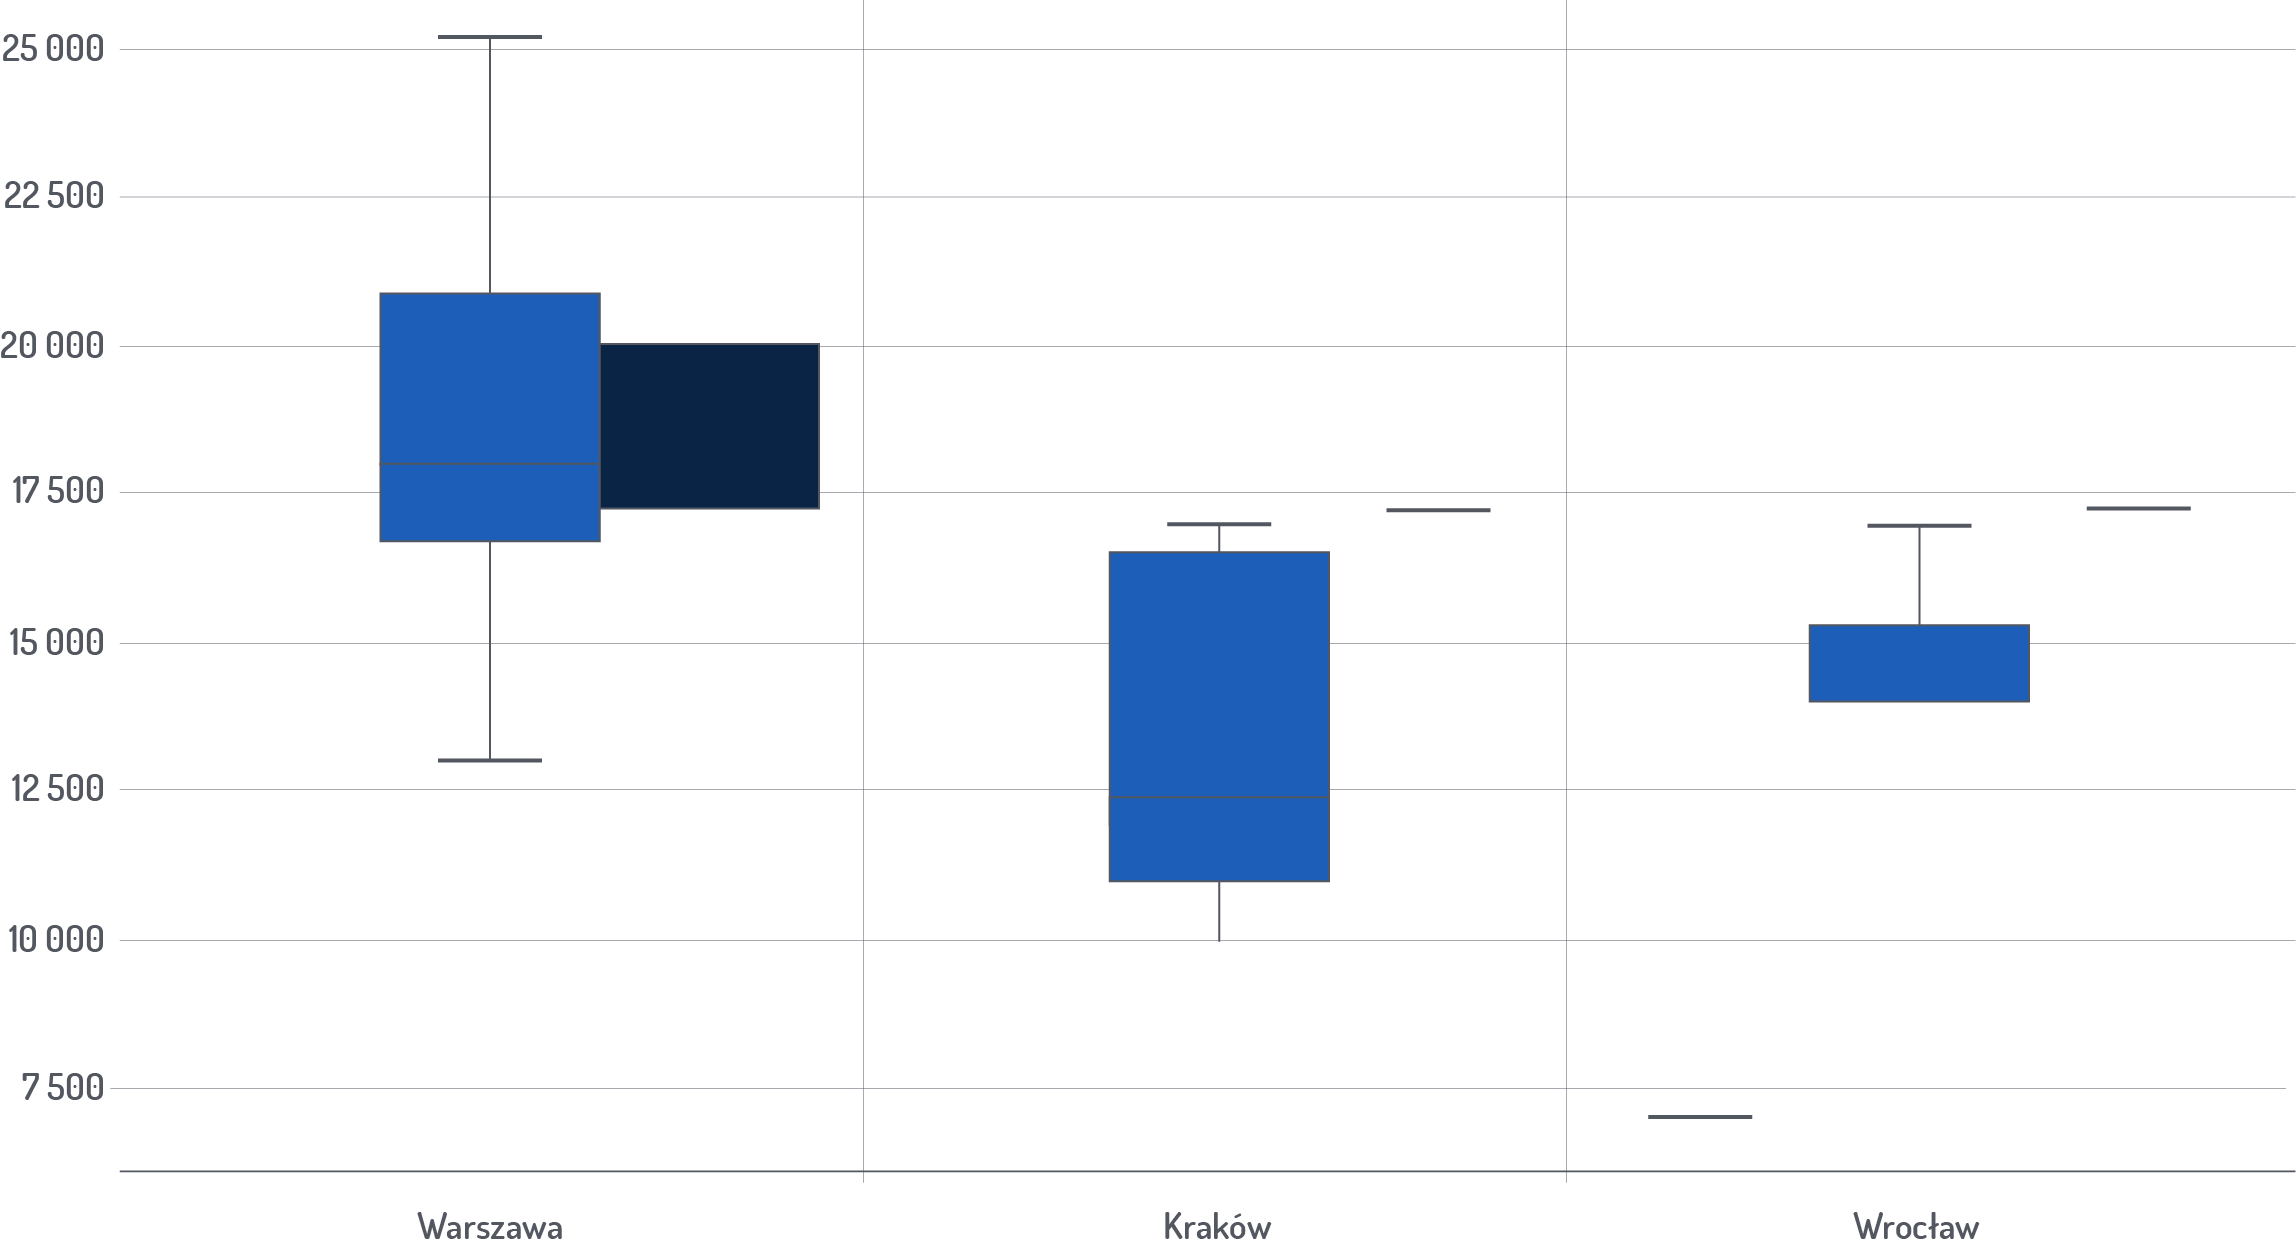
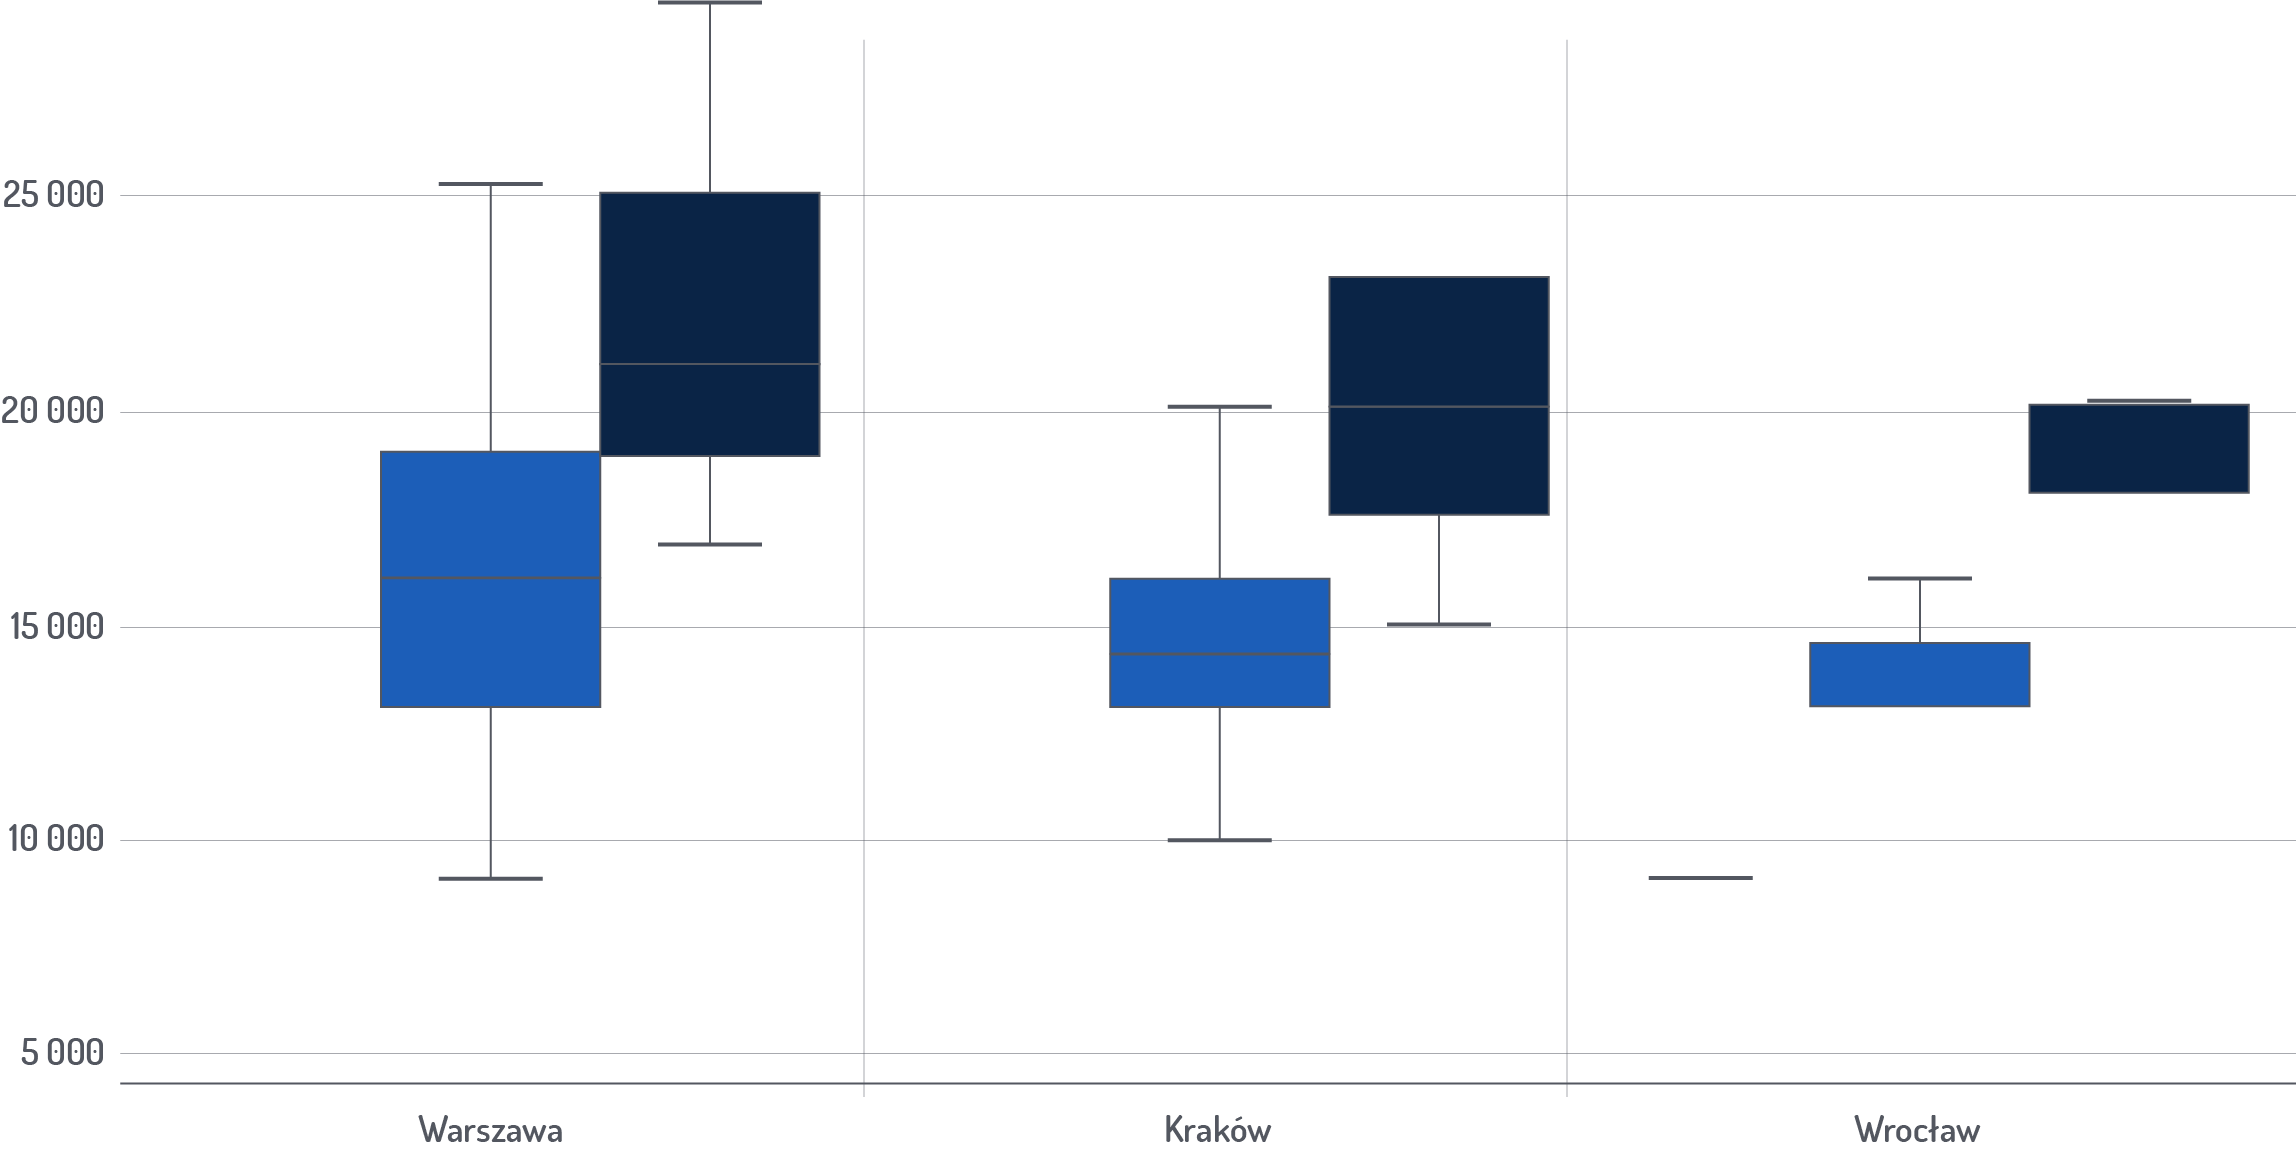
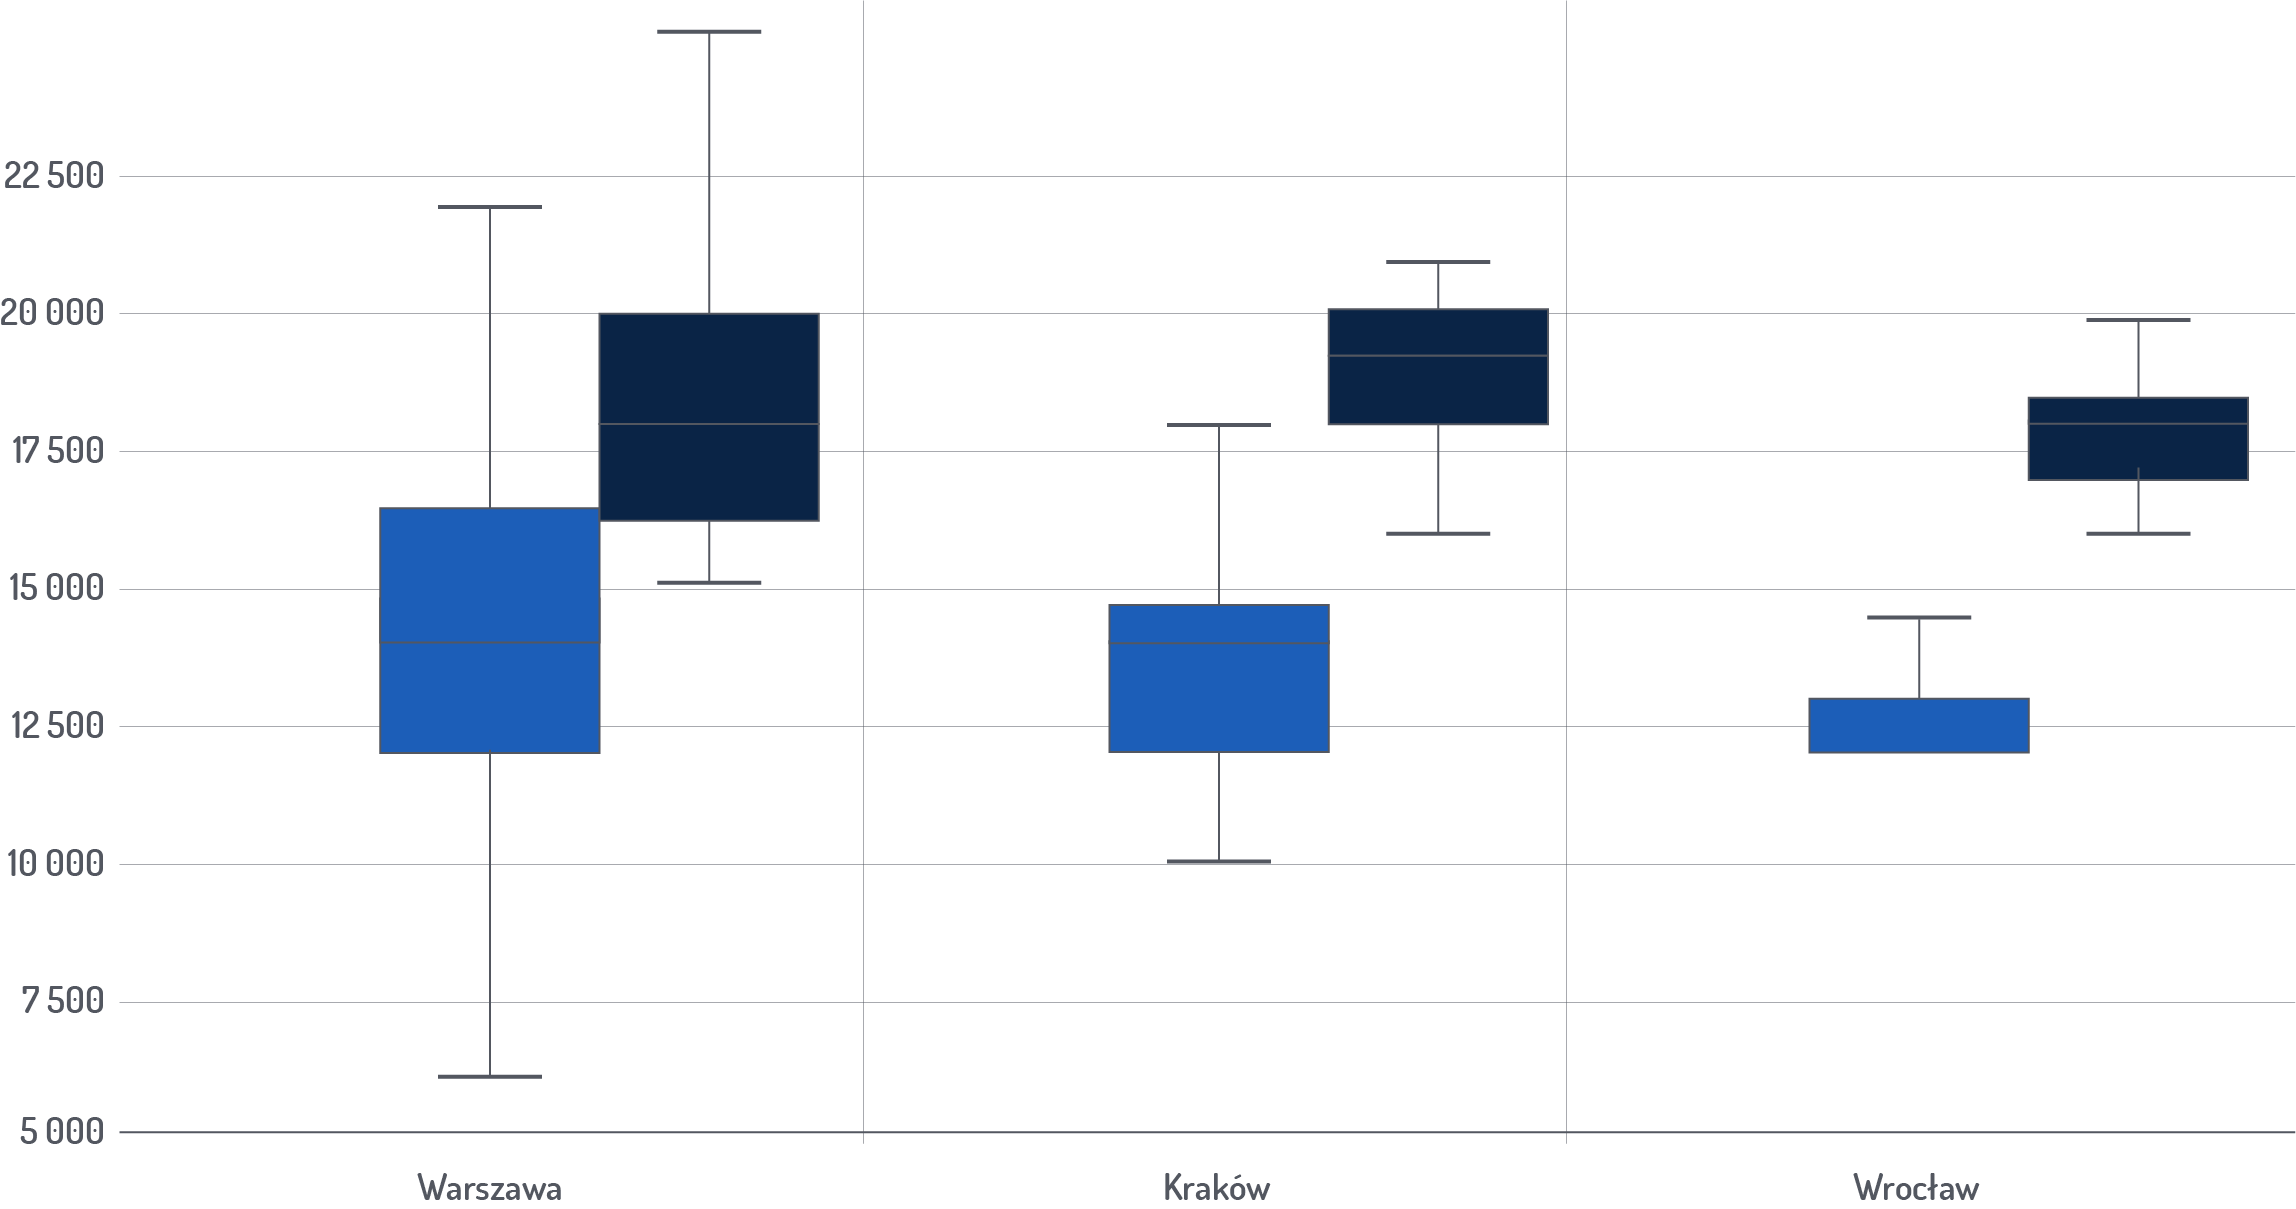
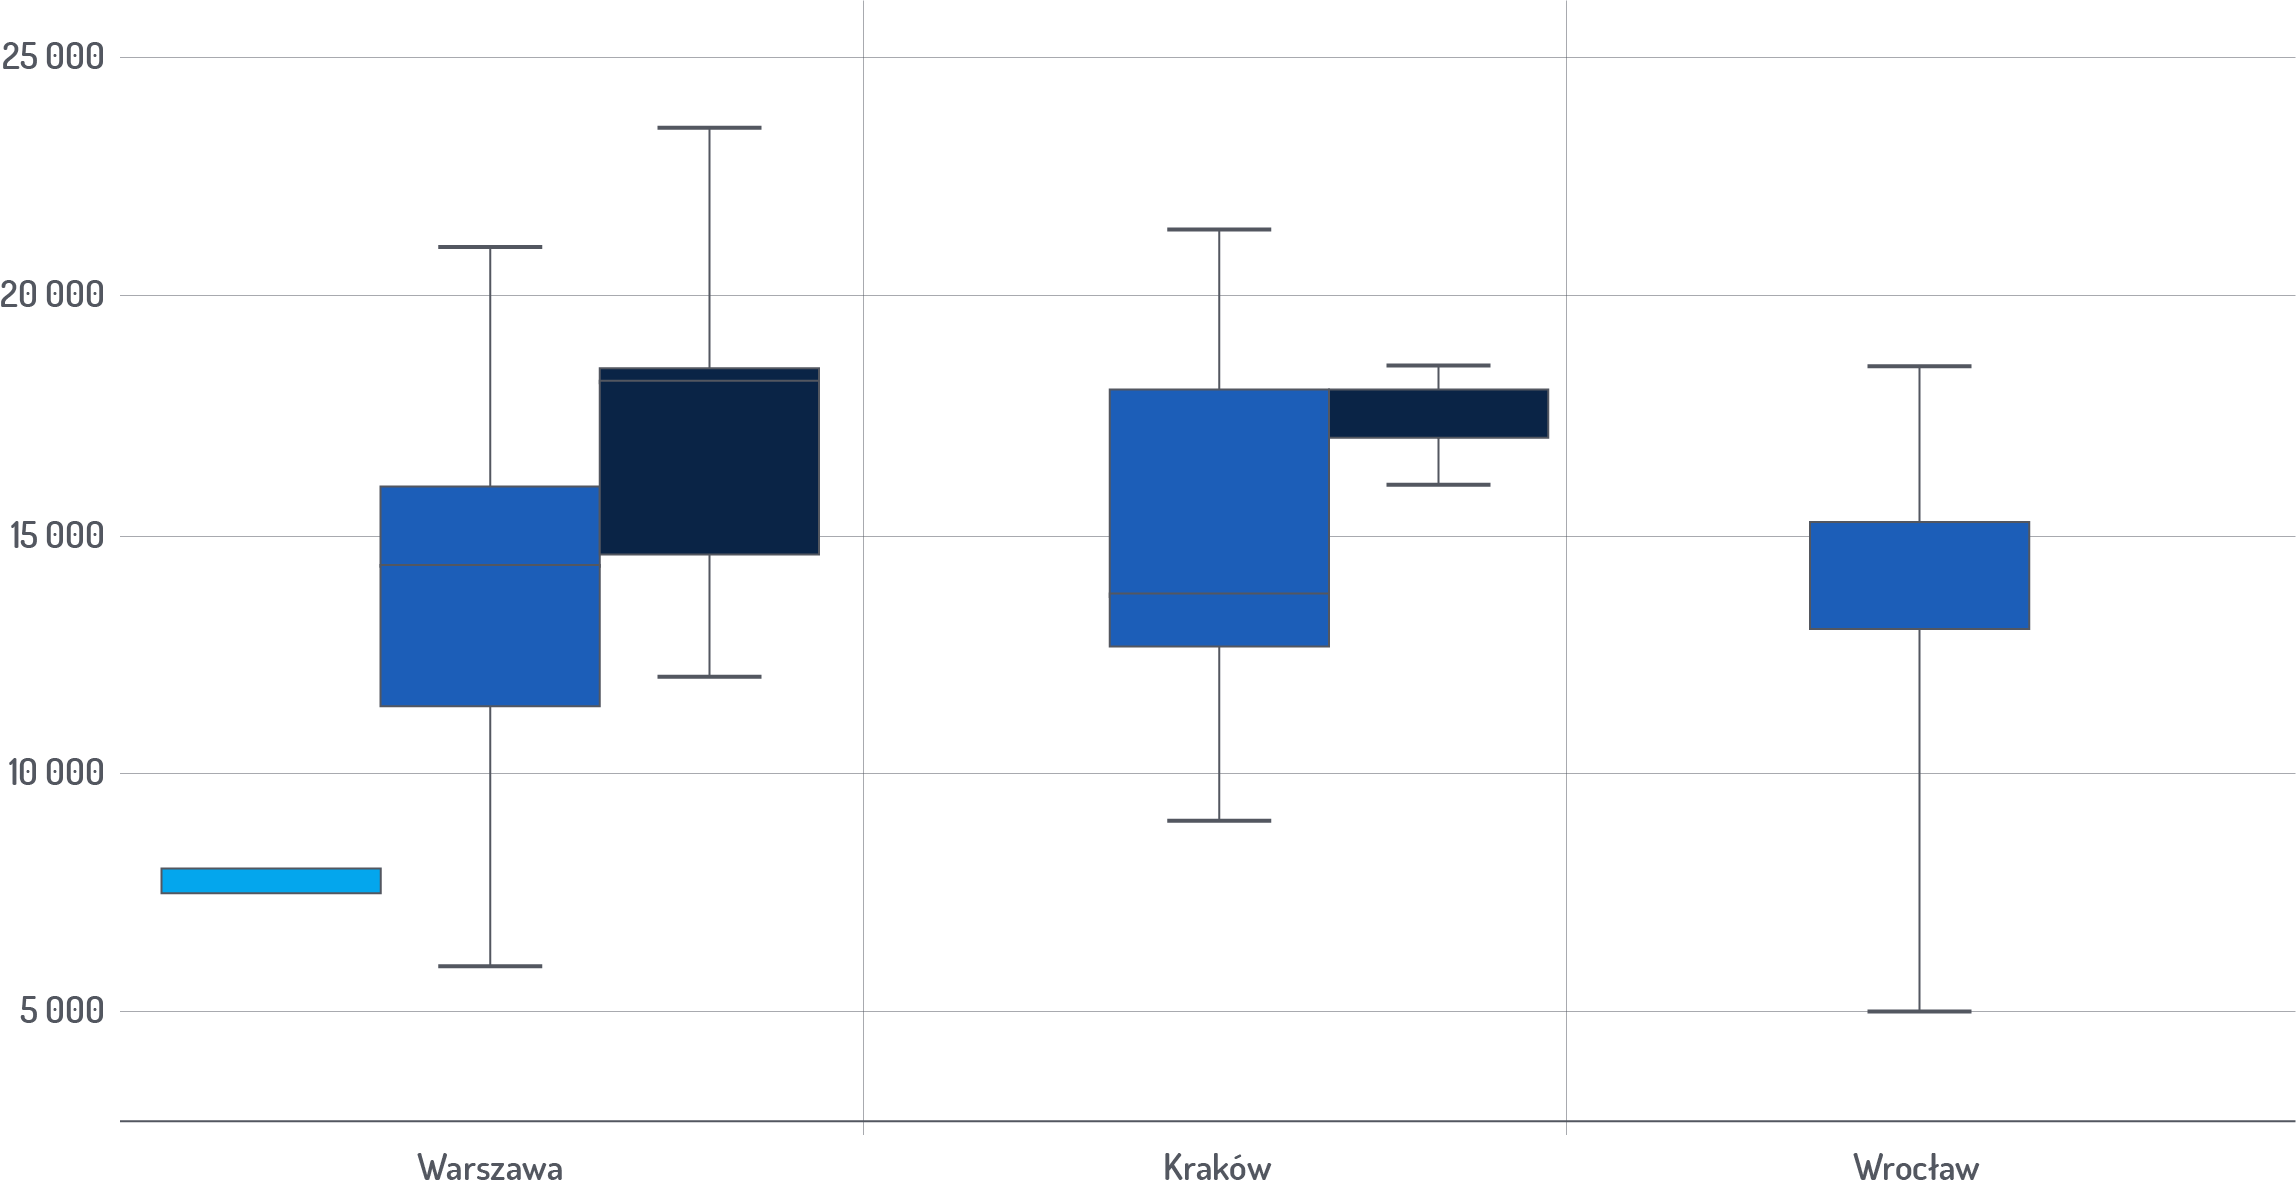
Do you earn the most in Warsaw?
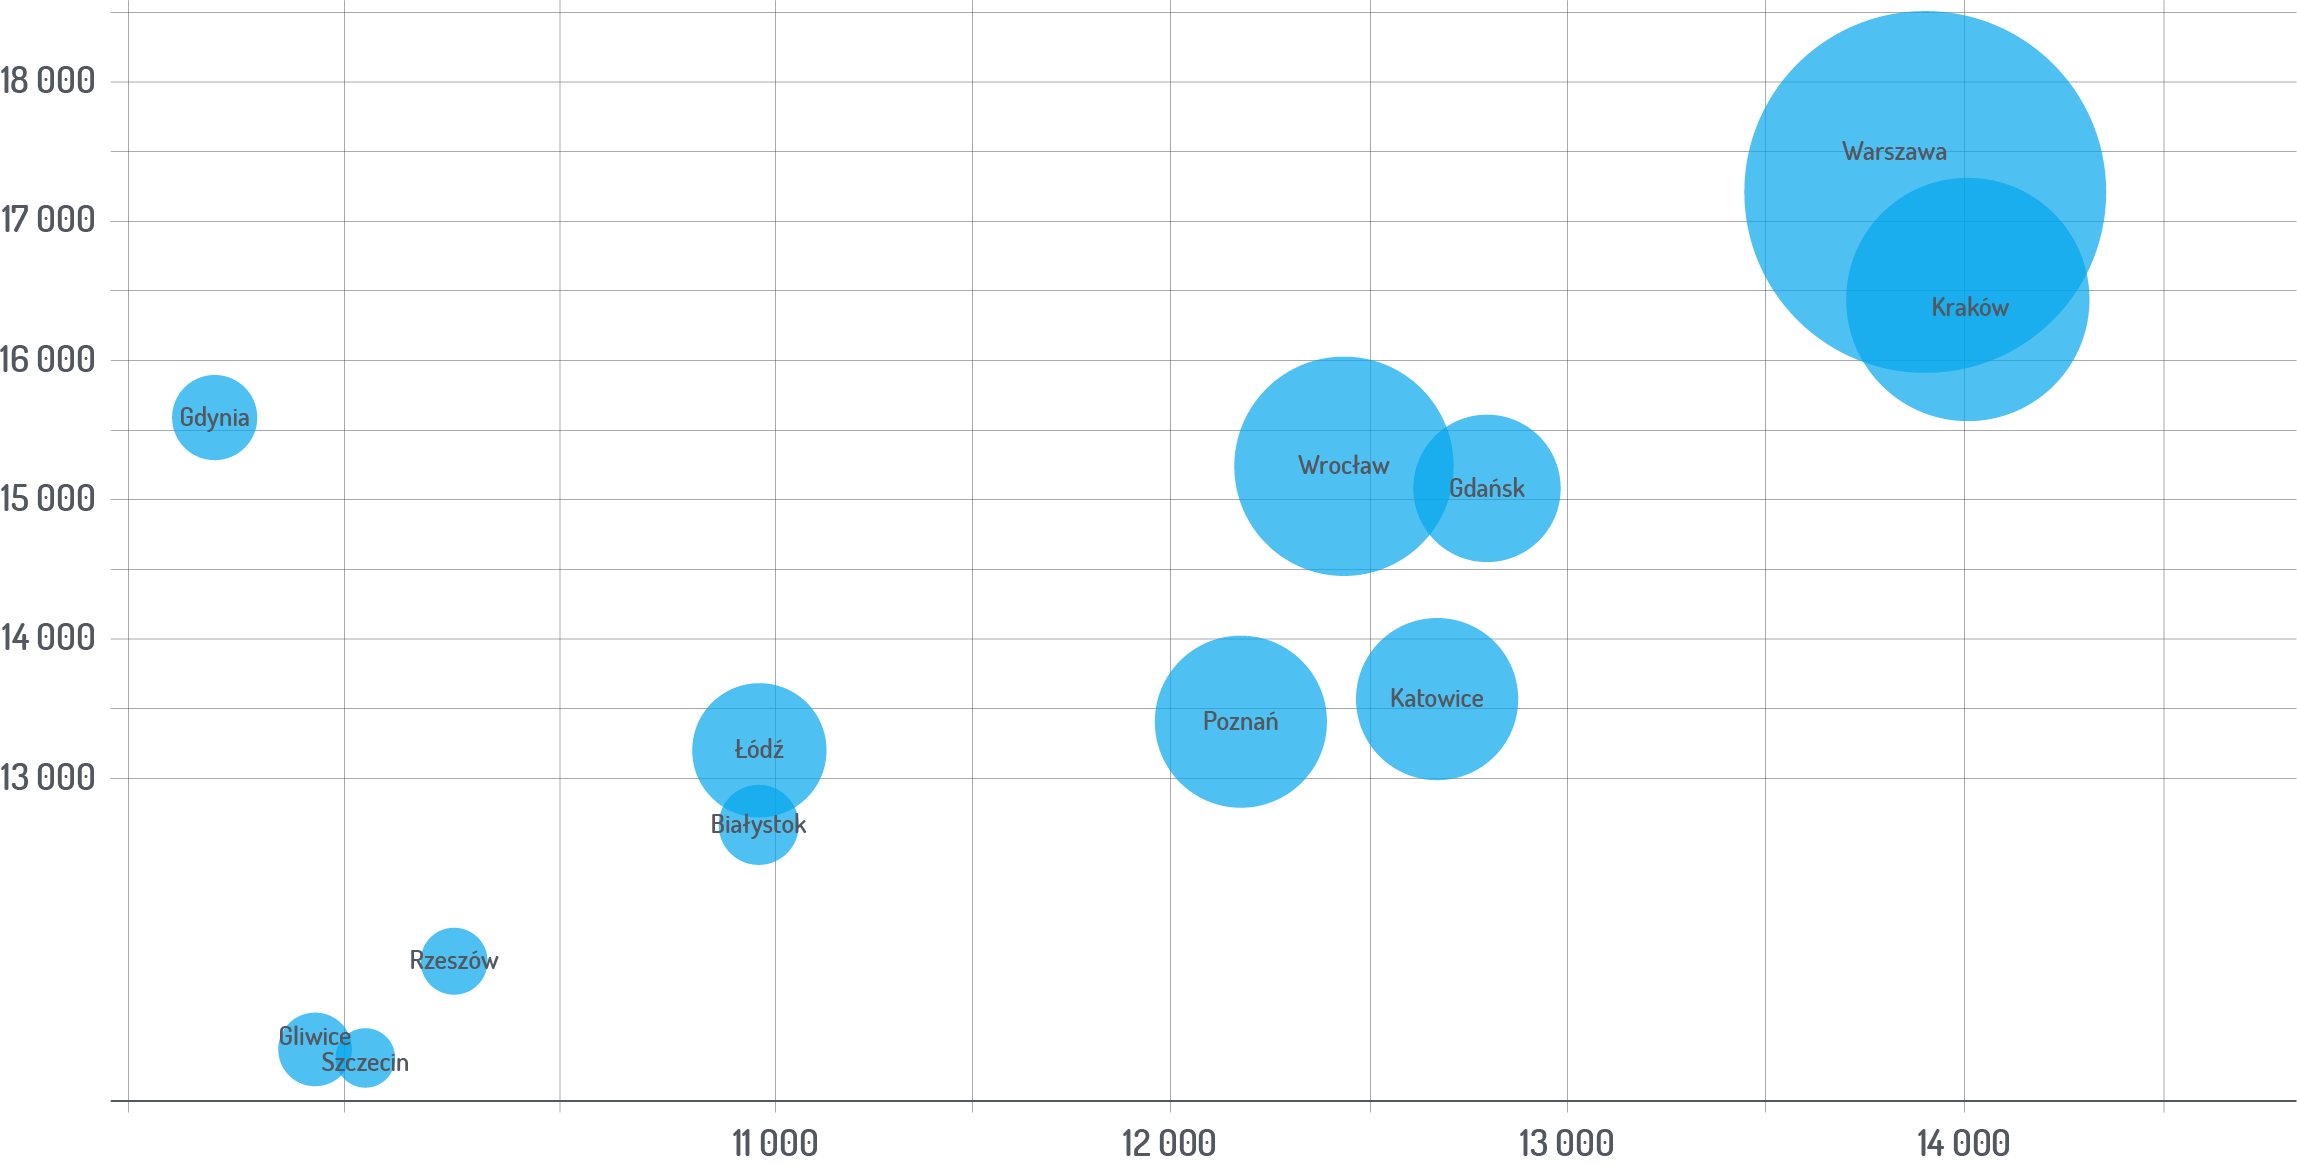
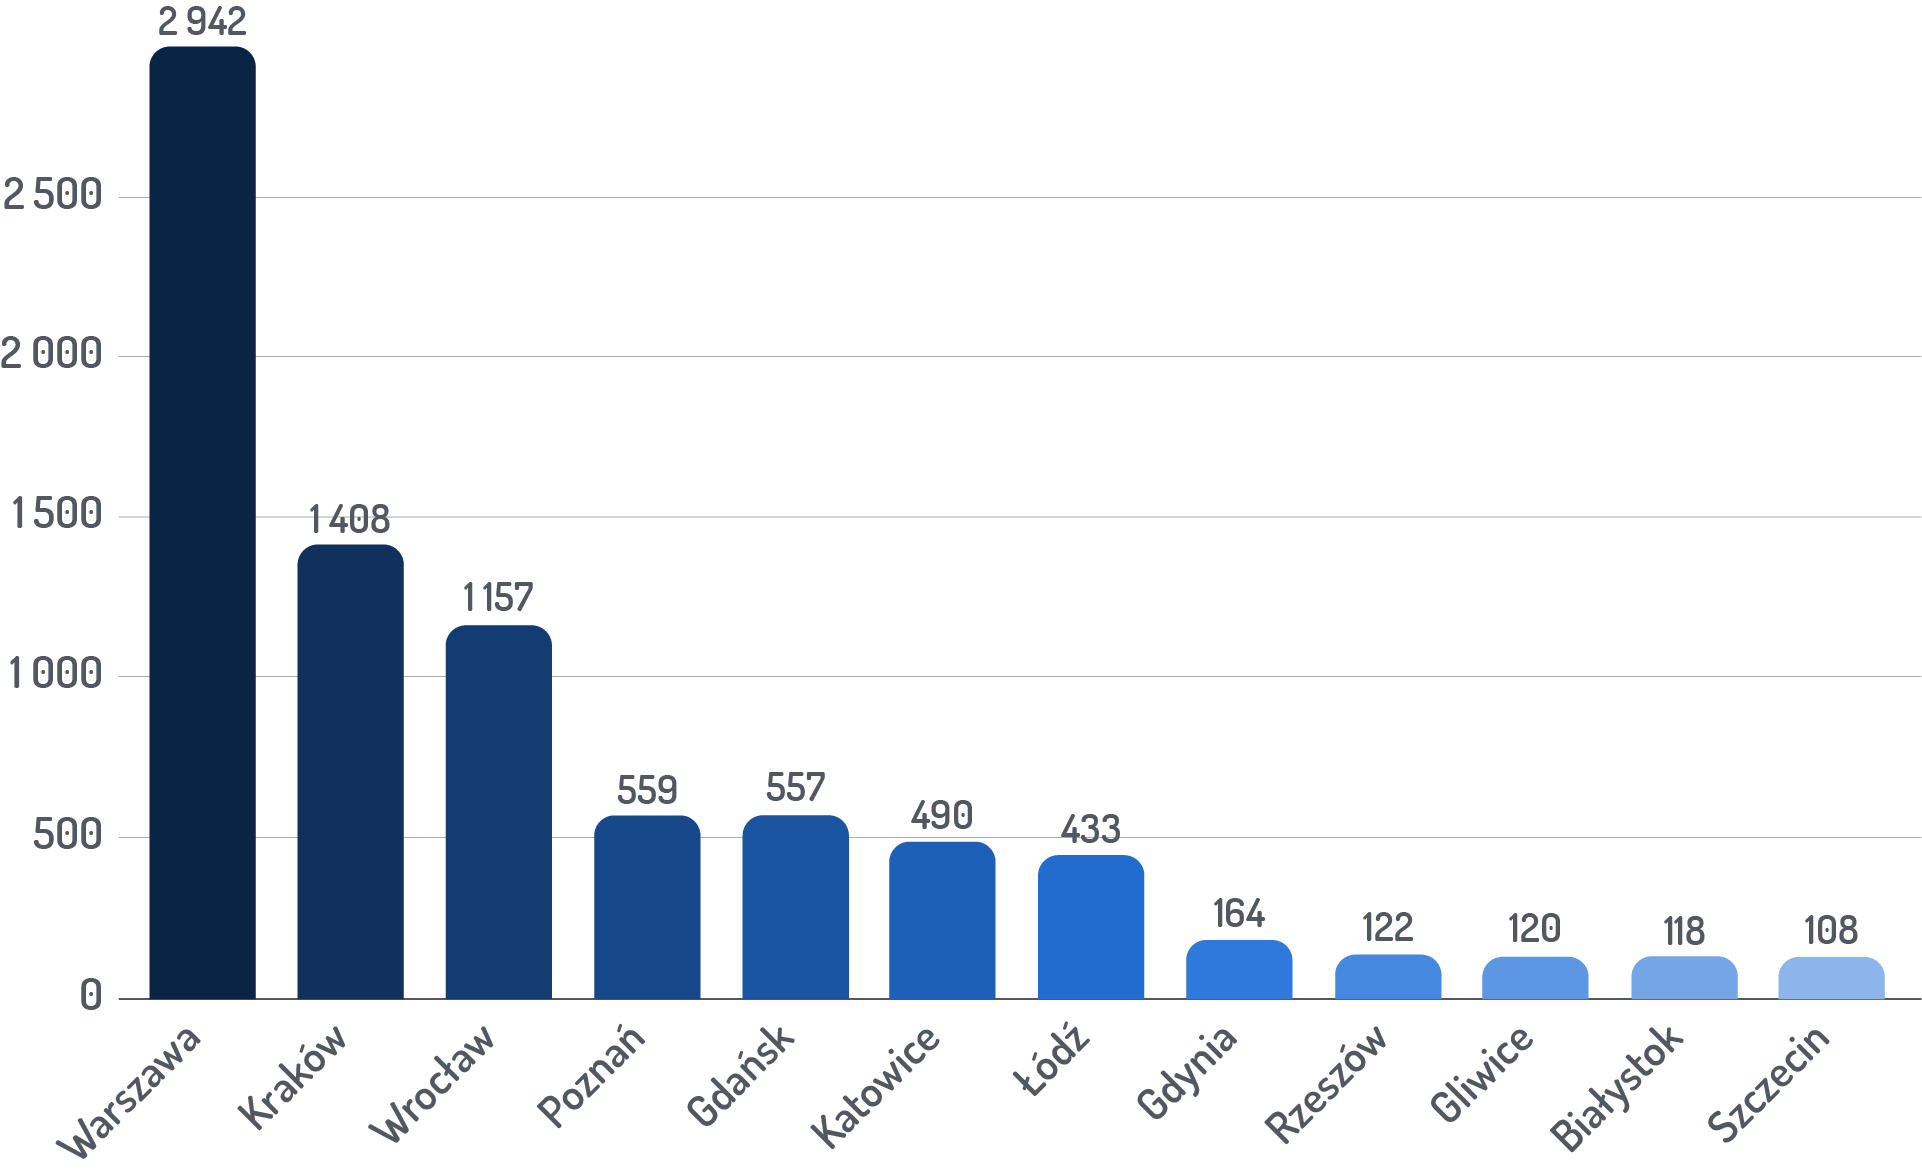
As a reminder, on the right you can see average rates in individual cities from the report Q2 2020
For B2B contracts, the average level of the upper range is the highest in Warsaw and amounts to PLN 17,914. Companies from Gdansk offer slightly less: PLN 17,814.
For contracts of employment, the average upper range is the highest in Szczecin and amounts to PLN 17,037. Krakow maintains consistently high earnings for the contracts of employment to PLN 14,538. Compared to the previous quarter, we see an equalization of rates in between cities.
It ‘s worth mentioning, that the statistics for Szczecin was built on a small sample, which explains such big differences for this city compared to the previous quarter (previous page).
The demand for seniors is increasing
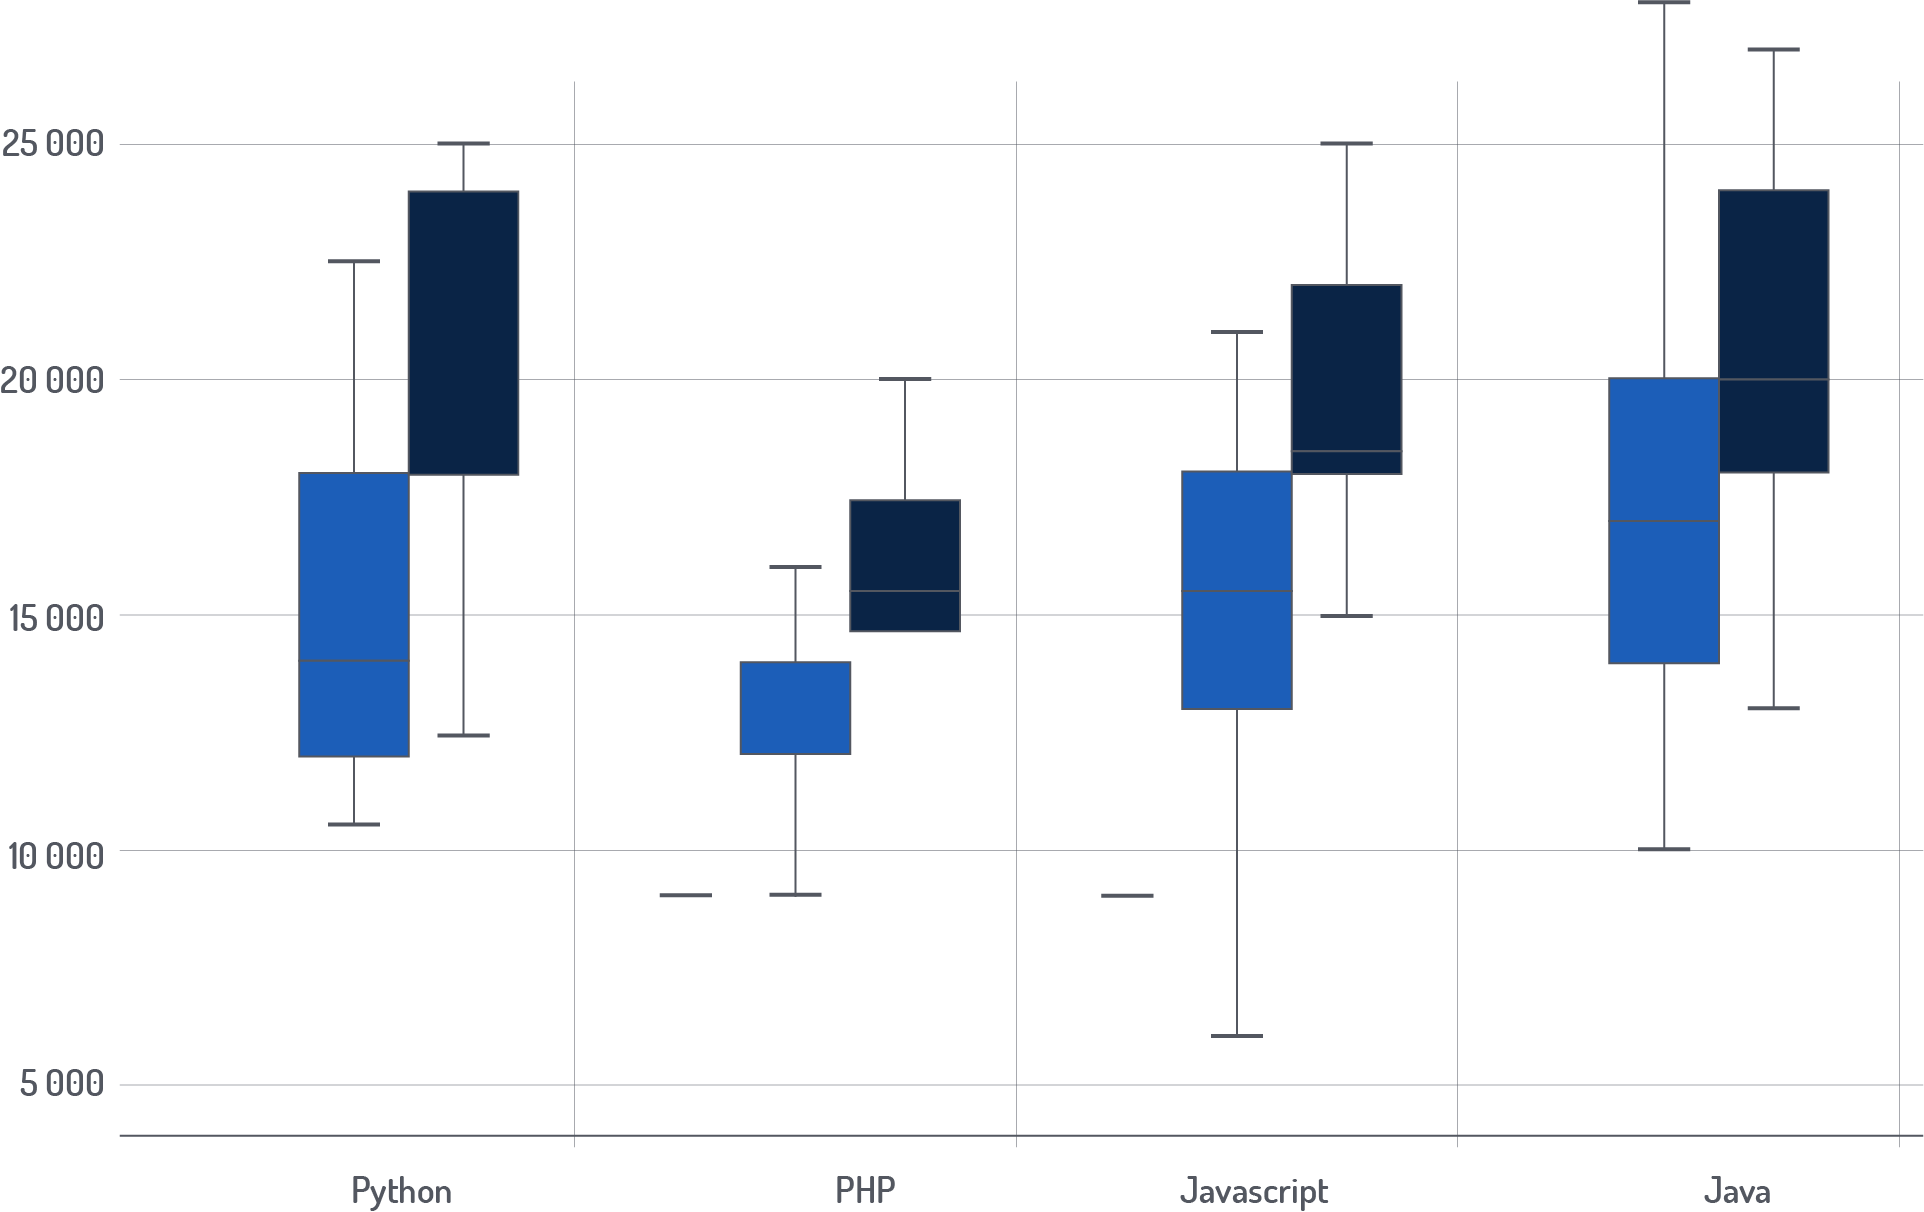
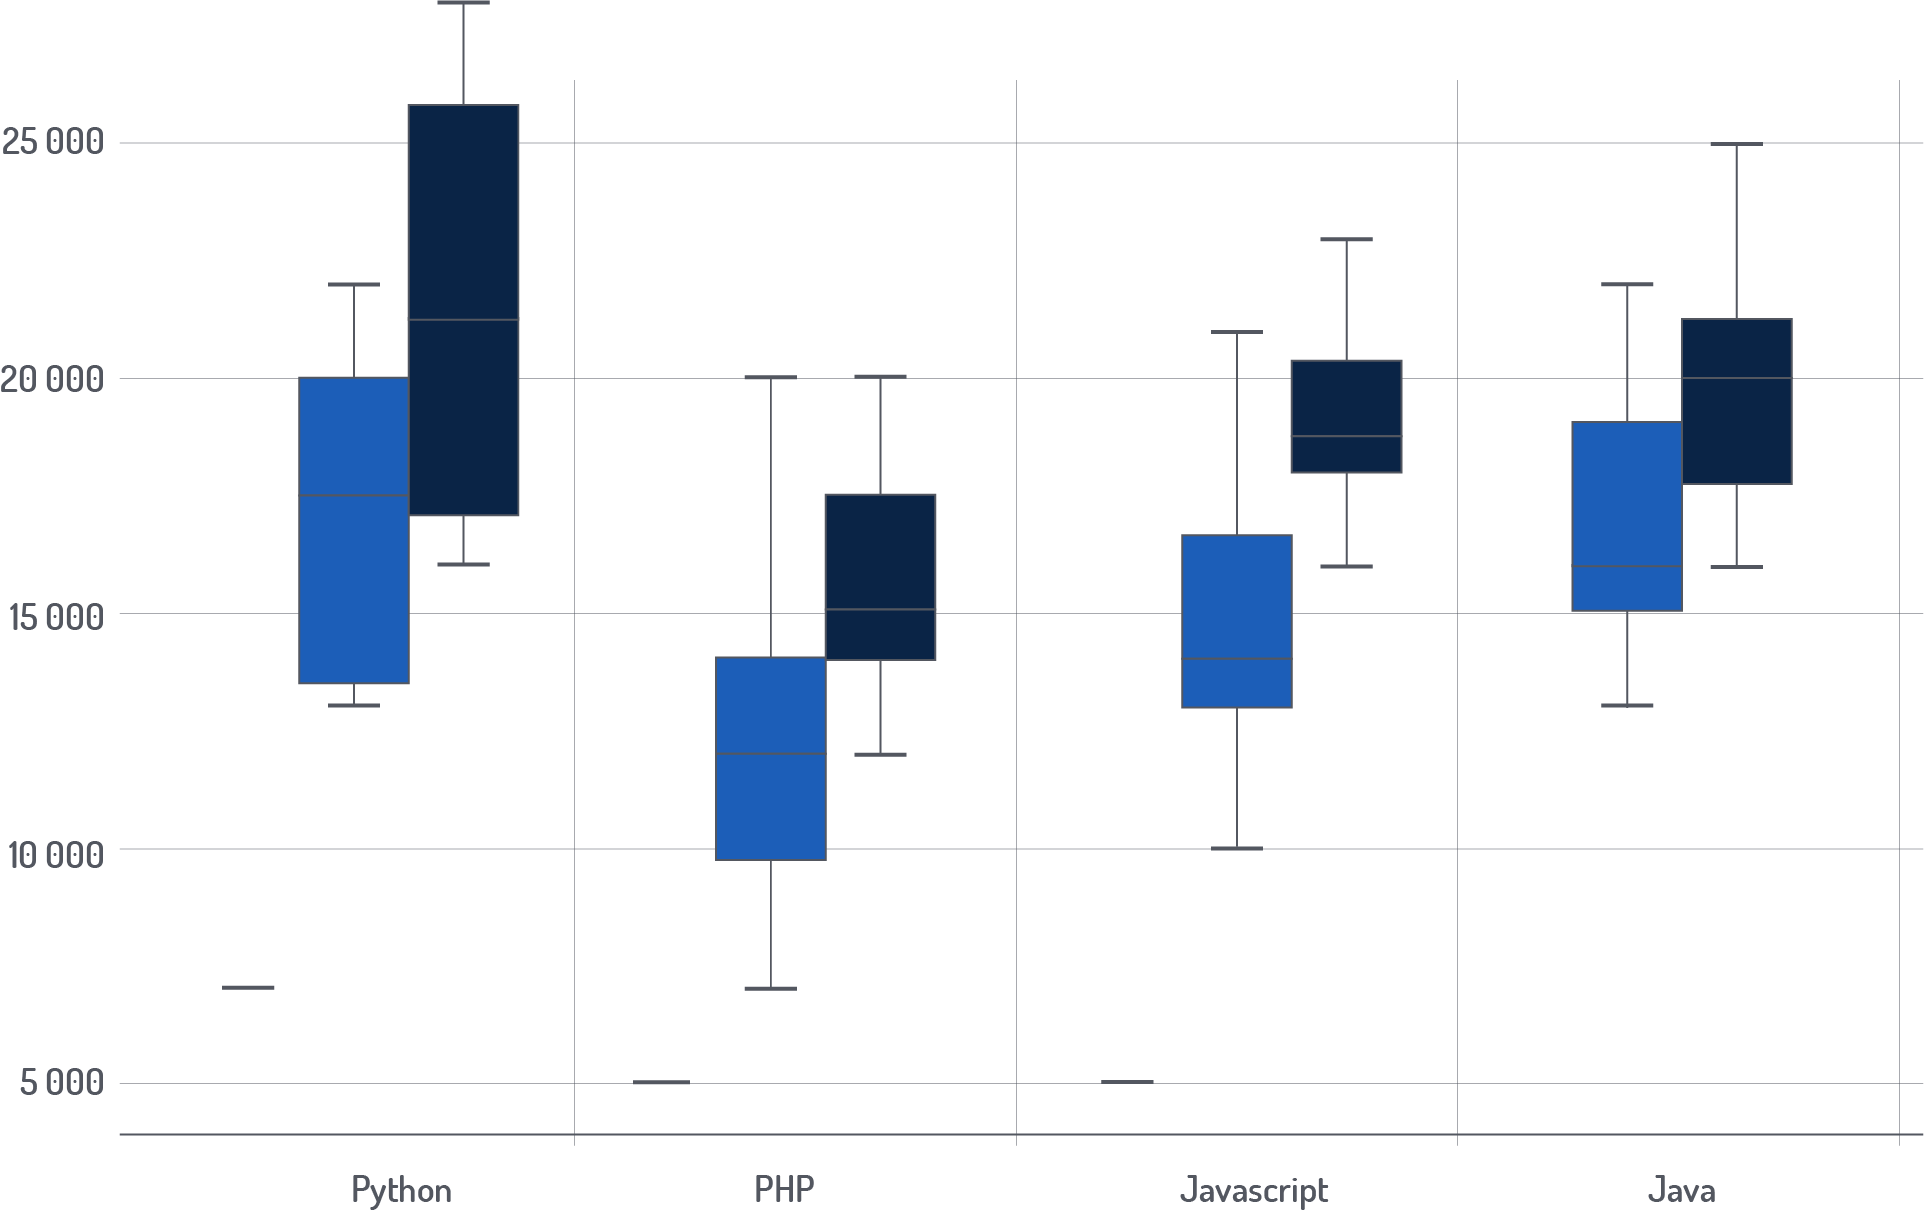
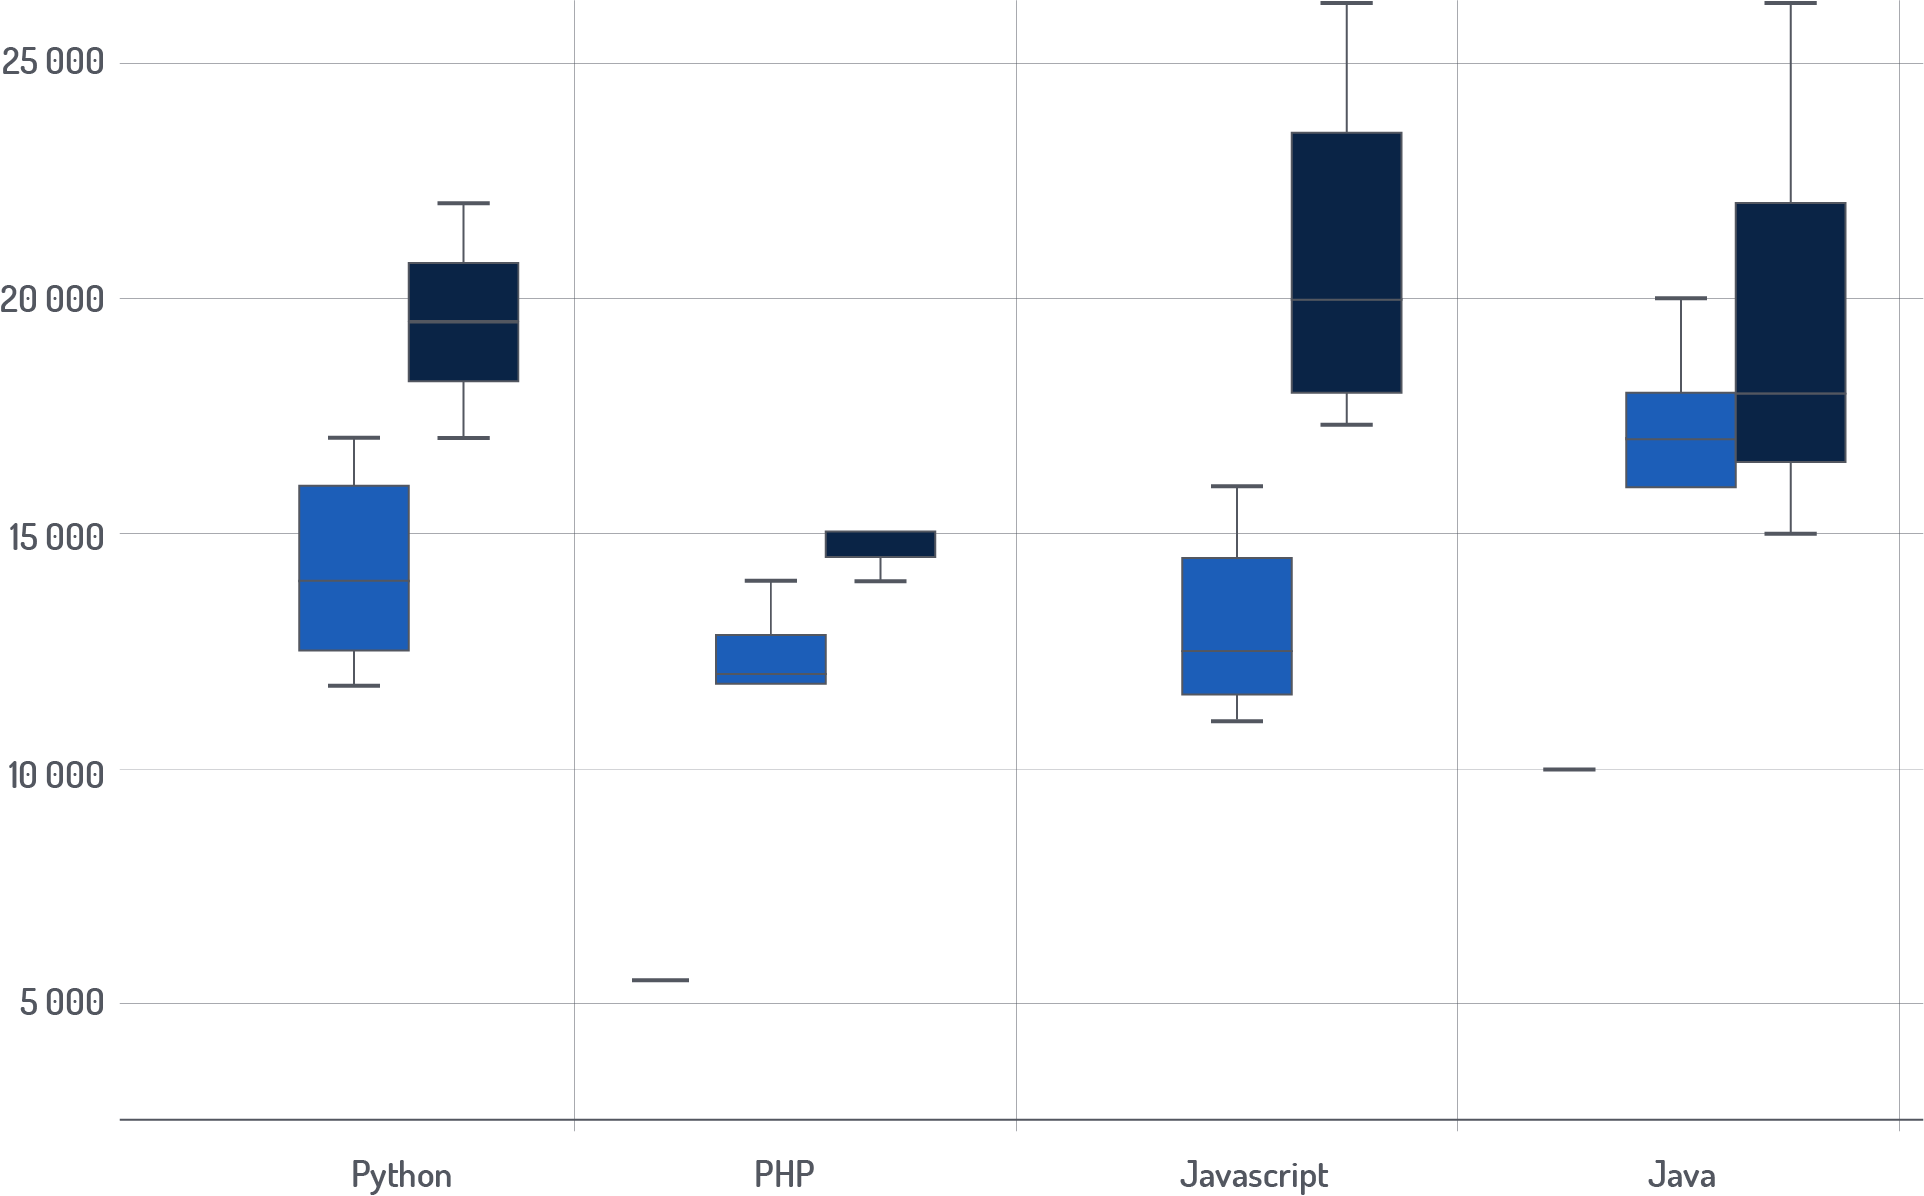
Programming languages vs salaries
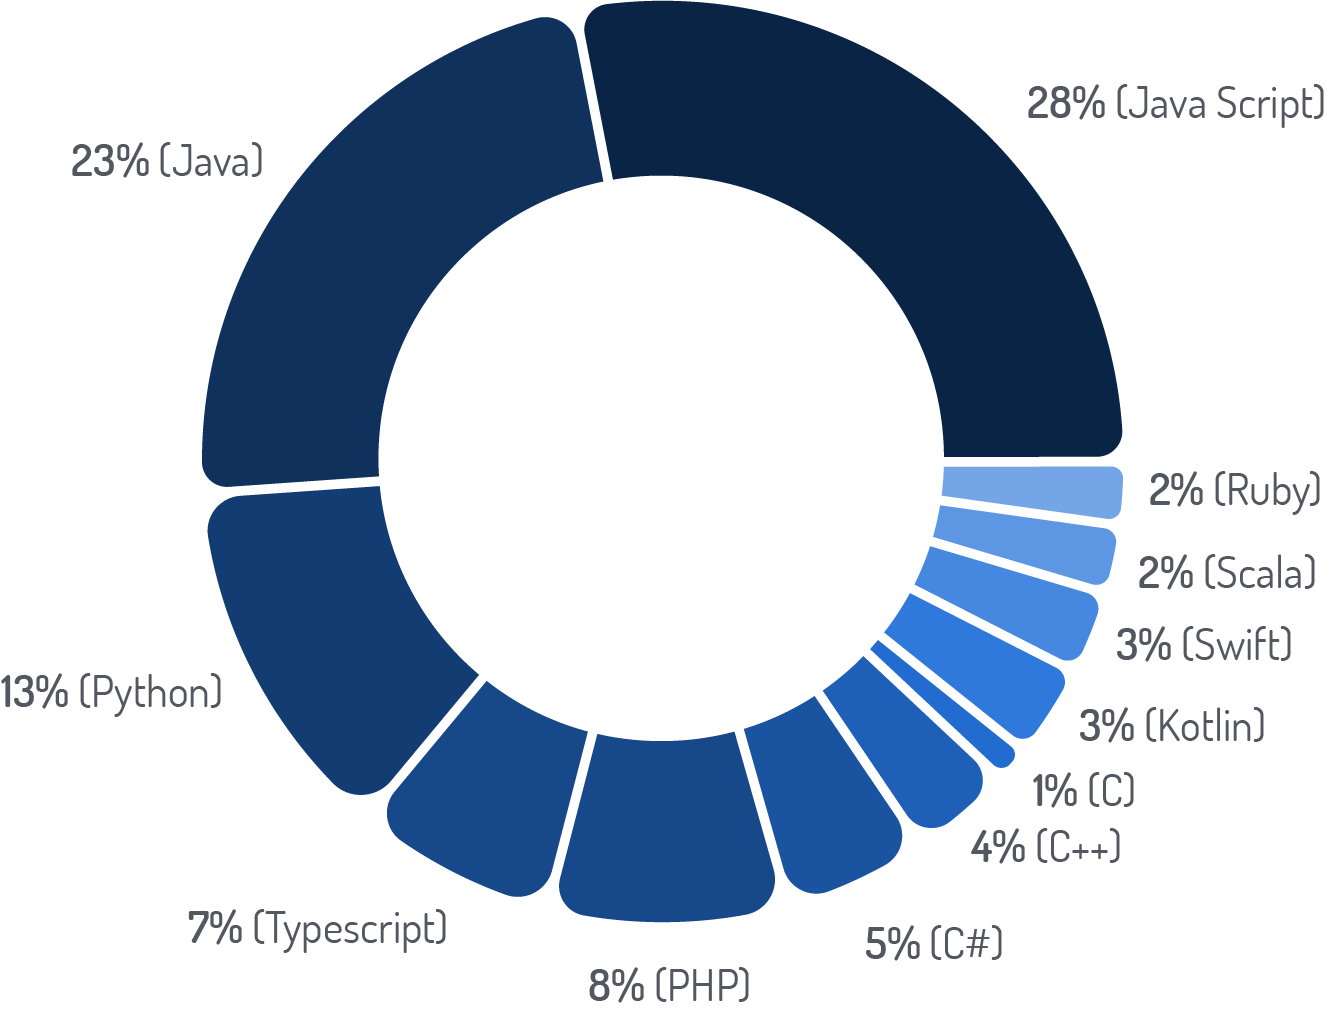
The most popular programming languages
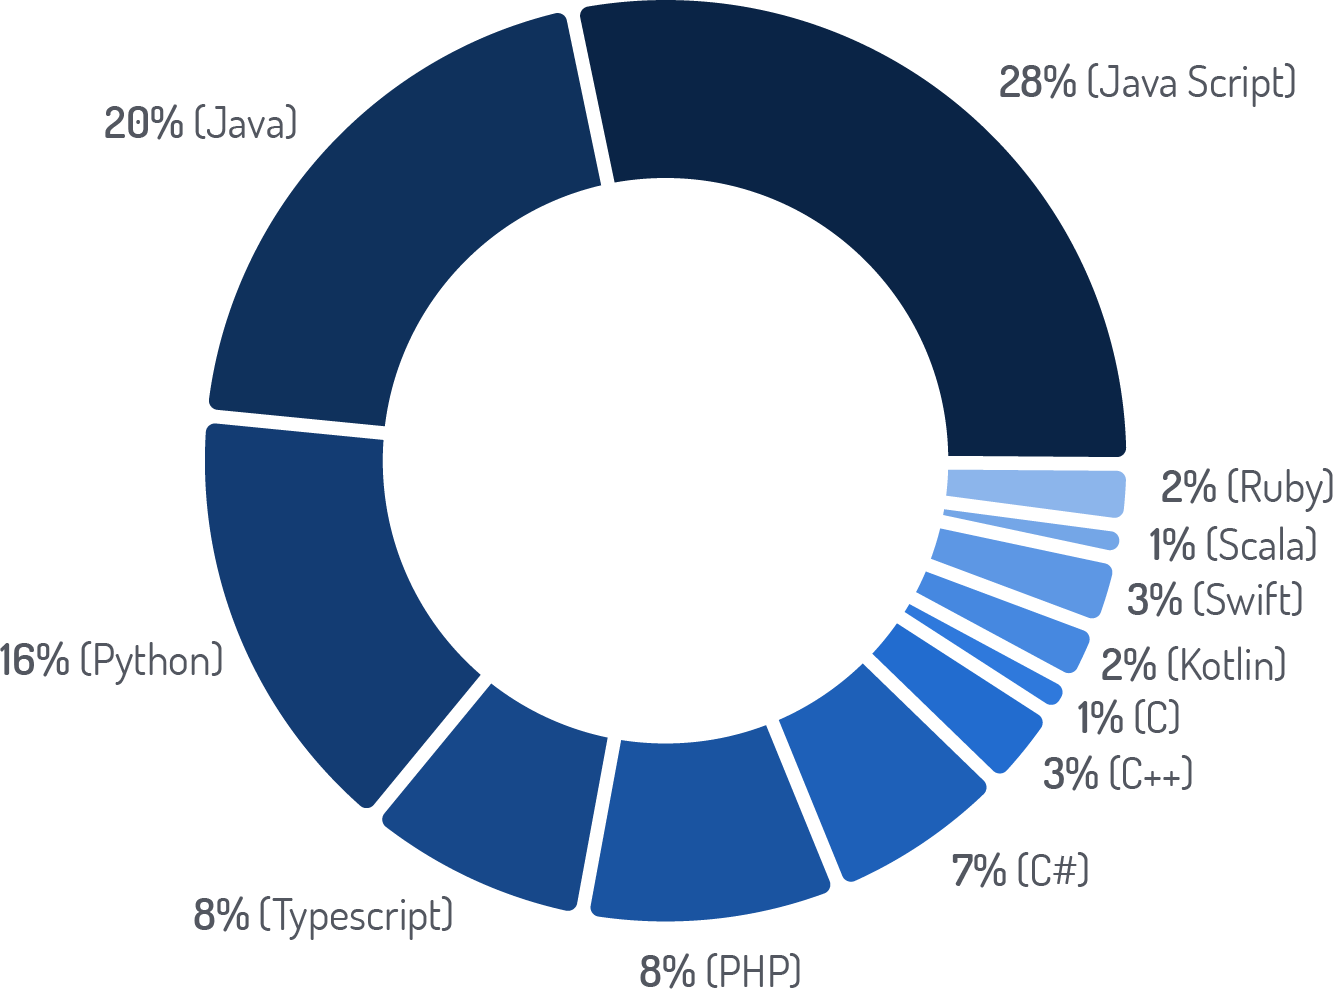
There are no significant changes to the programming languages category over the quarter. JavaScript is still the programming language most desired by employers. Java is right behind it (-3%), followed by Python, Typescript and PHP. In line with all the trends, Python continues to gain popularity (+ 3% compared to Q2).
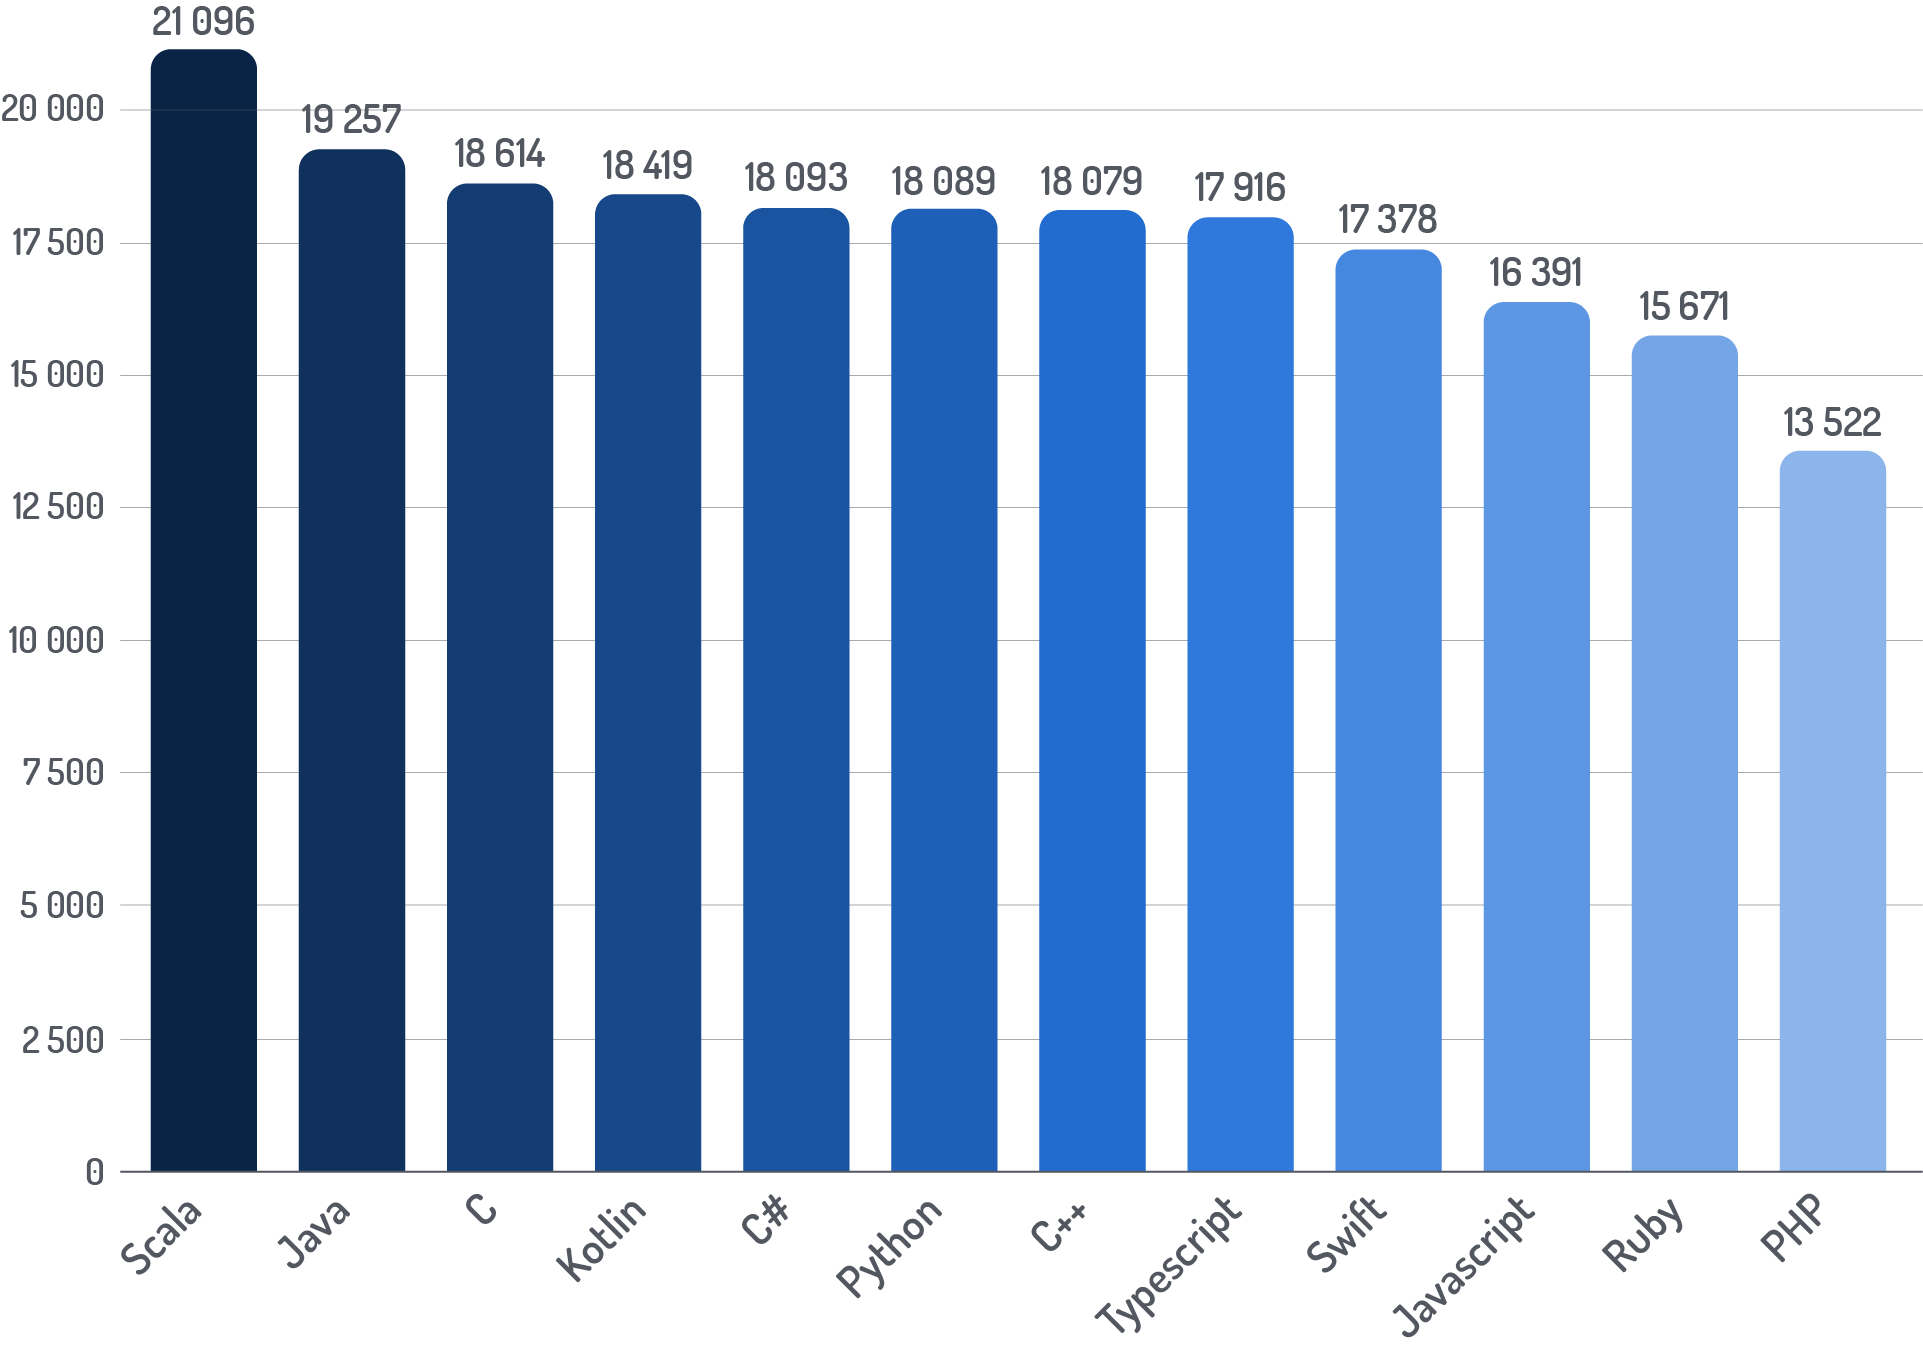
Programming languages vs salaries
Compared to the previous quarter, we can see little changes in the order of the list best paid programming languages, but above all we all see an increase in rates in comparison to Q2. It’s worth to recalling that in the report for Q2 we saw a drop in rates by about 10%, so the growth we are seeing now is in reality a return to the rates from Q1.
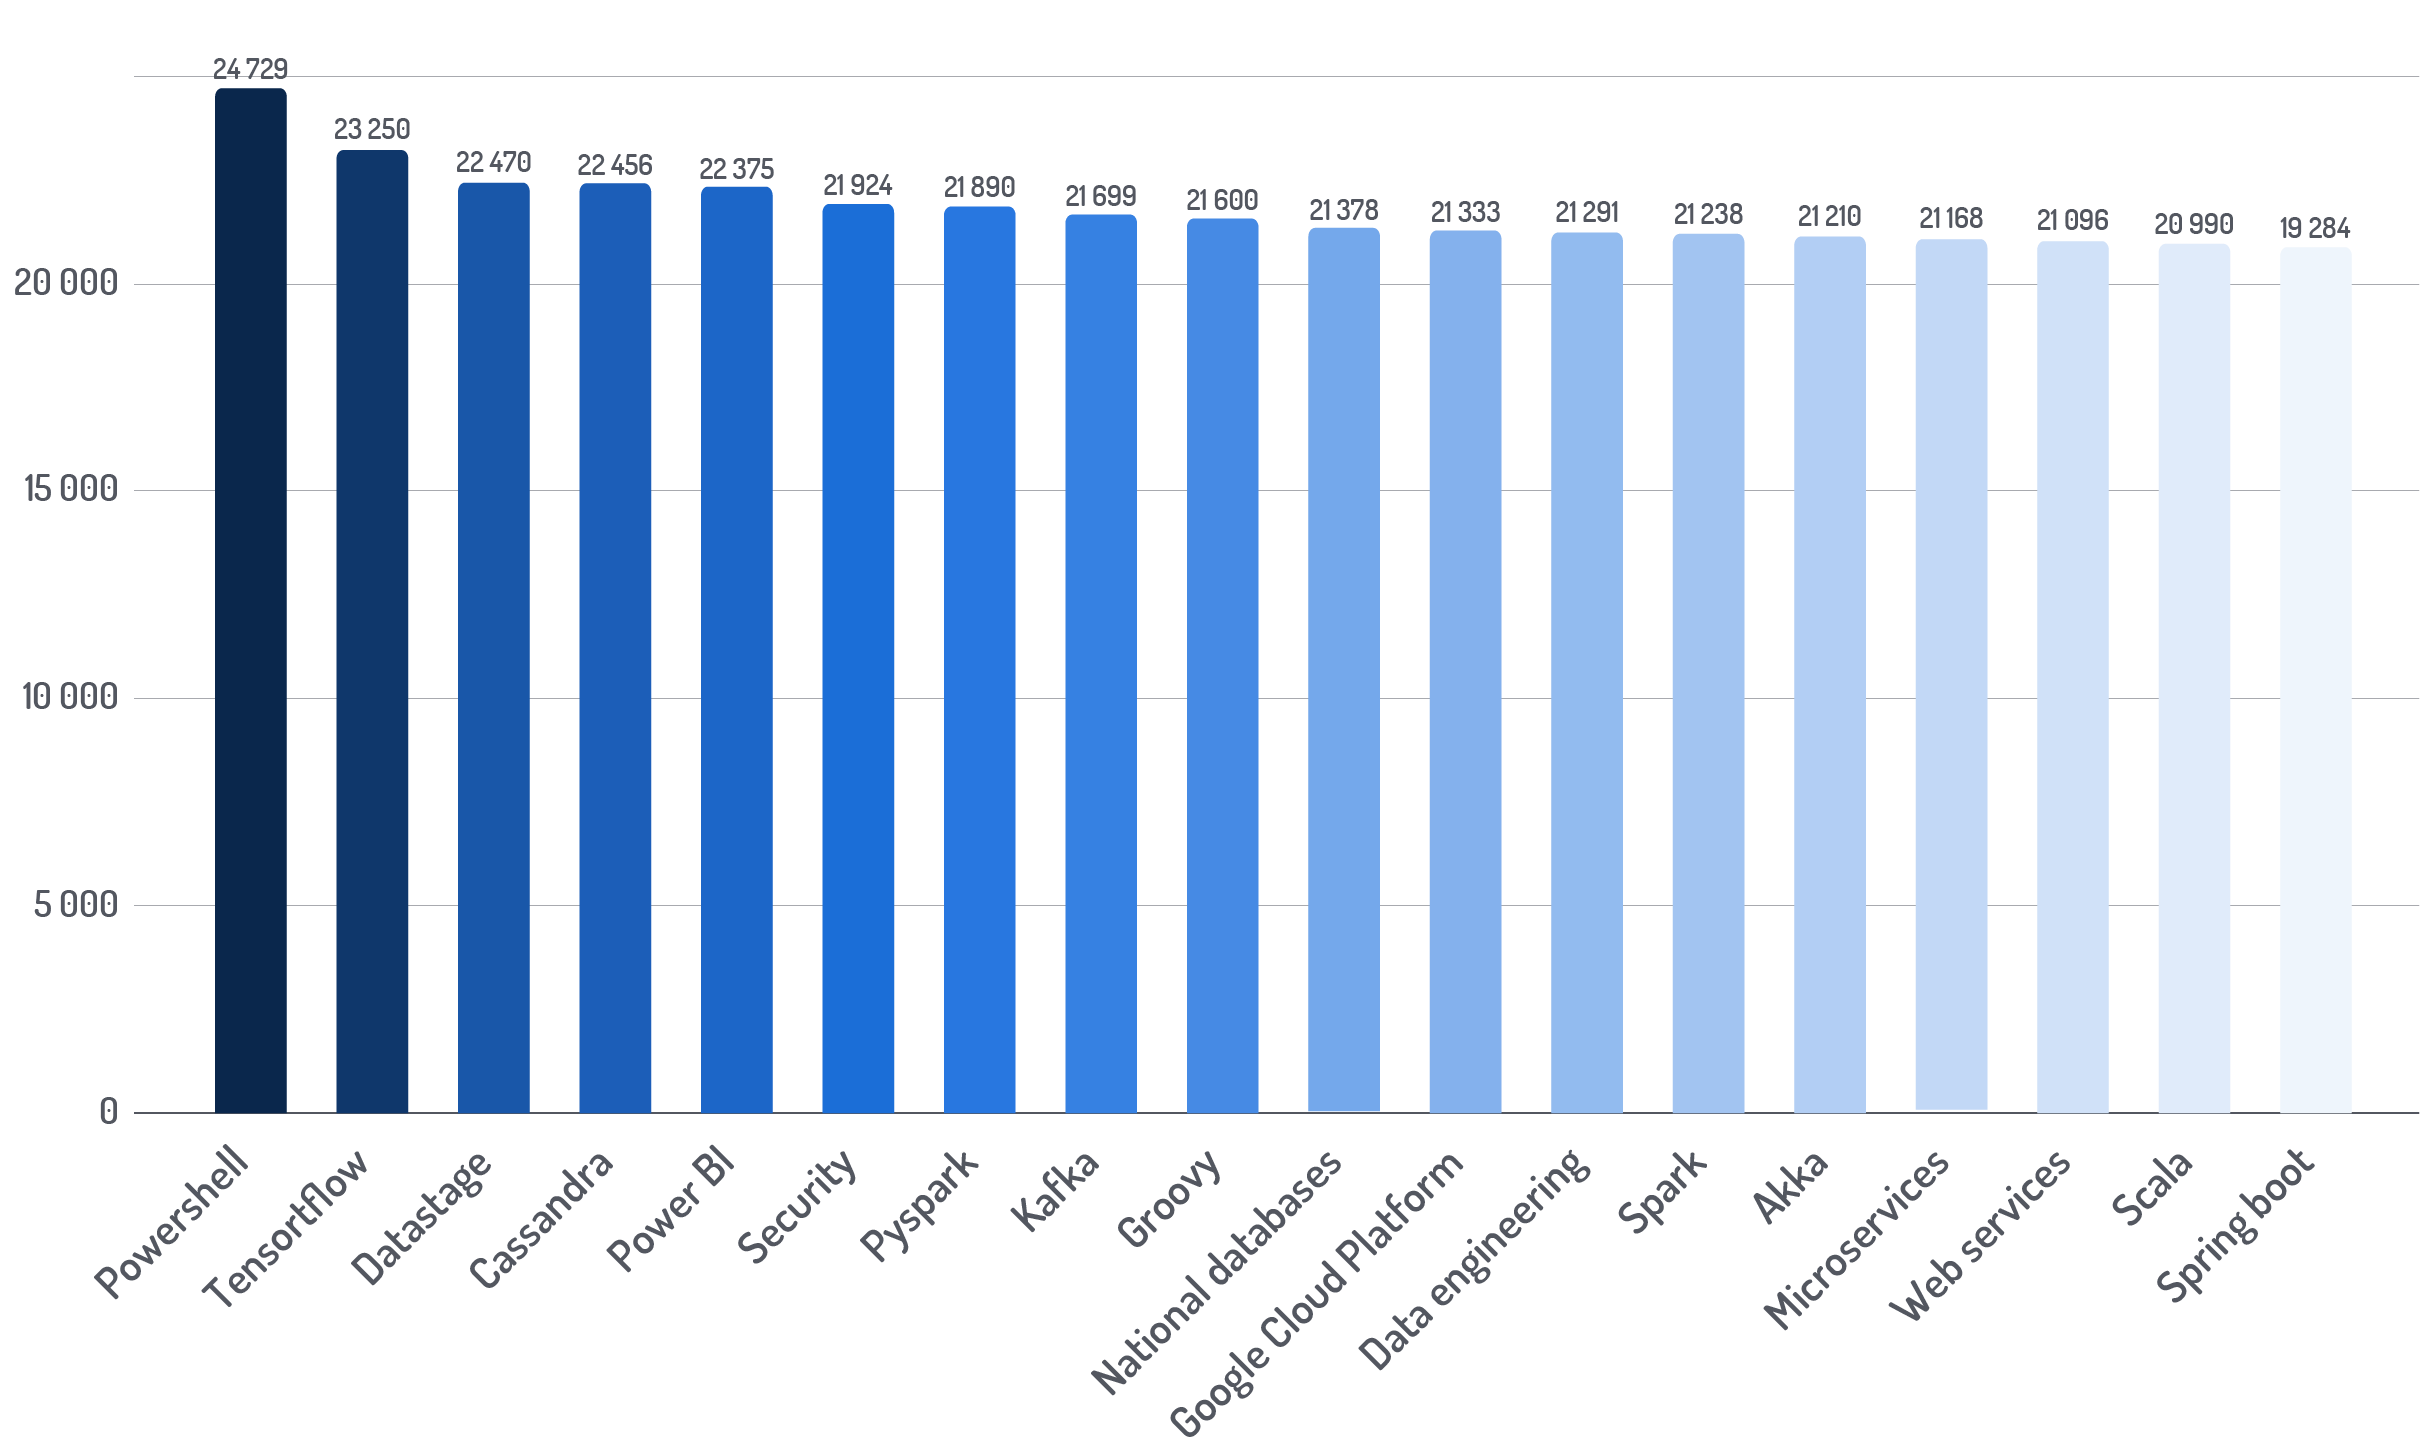
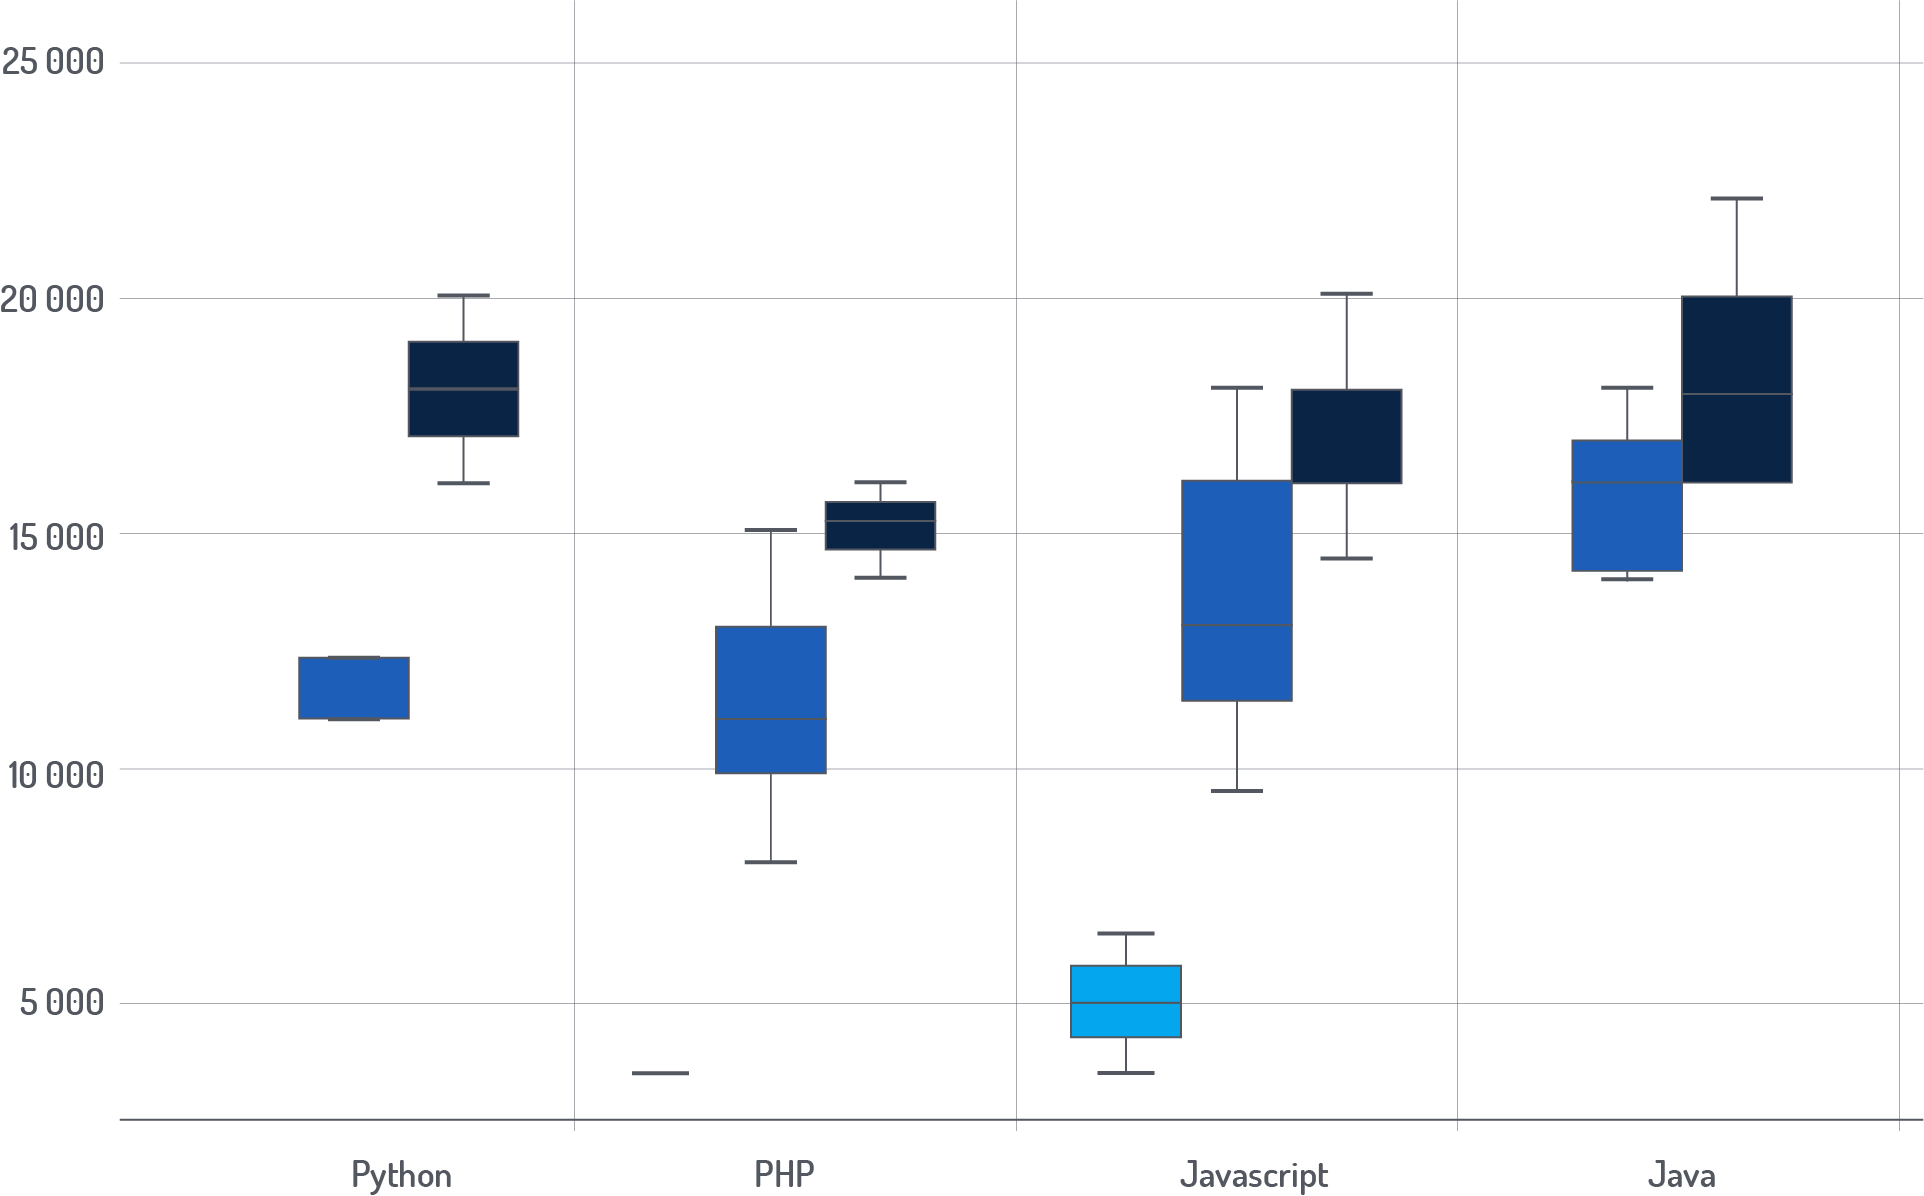
„Highest paid” keywords - Big Data wins
Invariably, Big Data technologies are the best paid offers available on the market.
In this case the biggest earnings were related to PowerShell technology from Microsoft. It is interesting to notice the appeareance of Tensorflow in the top three best paid technologies. Tensorflow is a framework used in the deep learning neural networks – Big Data competences and machine learning are still appreciated.
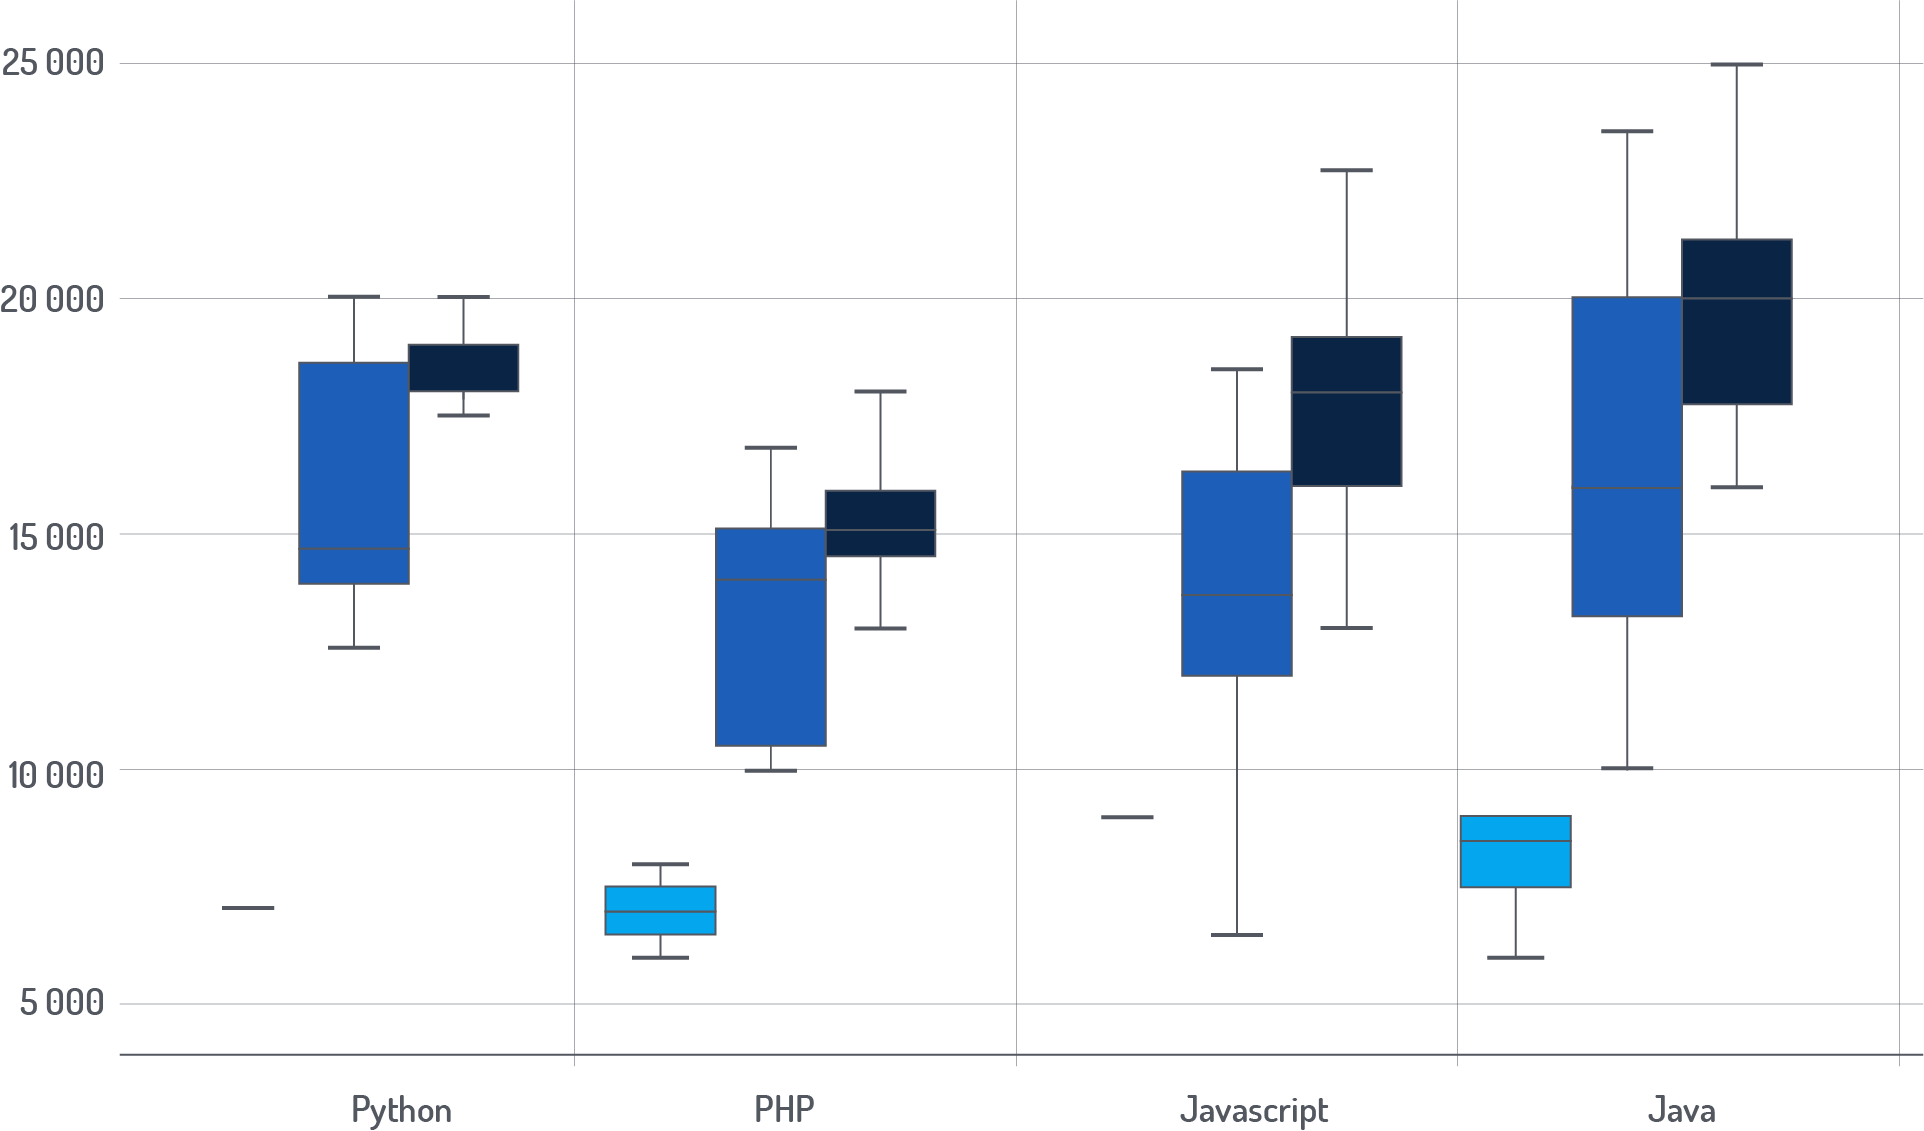
Experience vs salary
Salary dependent on experience
Sample salaries dependent on the role
On the basis of the chart (comparing it with data from Q2 2020), we can still see an almost complete lack of junior offers
You can also see that salary ranges for Mid and Seniors go up.
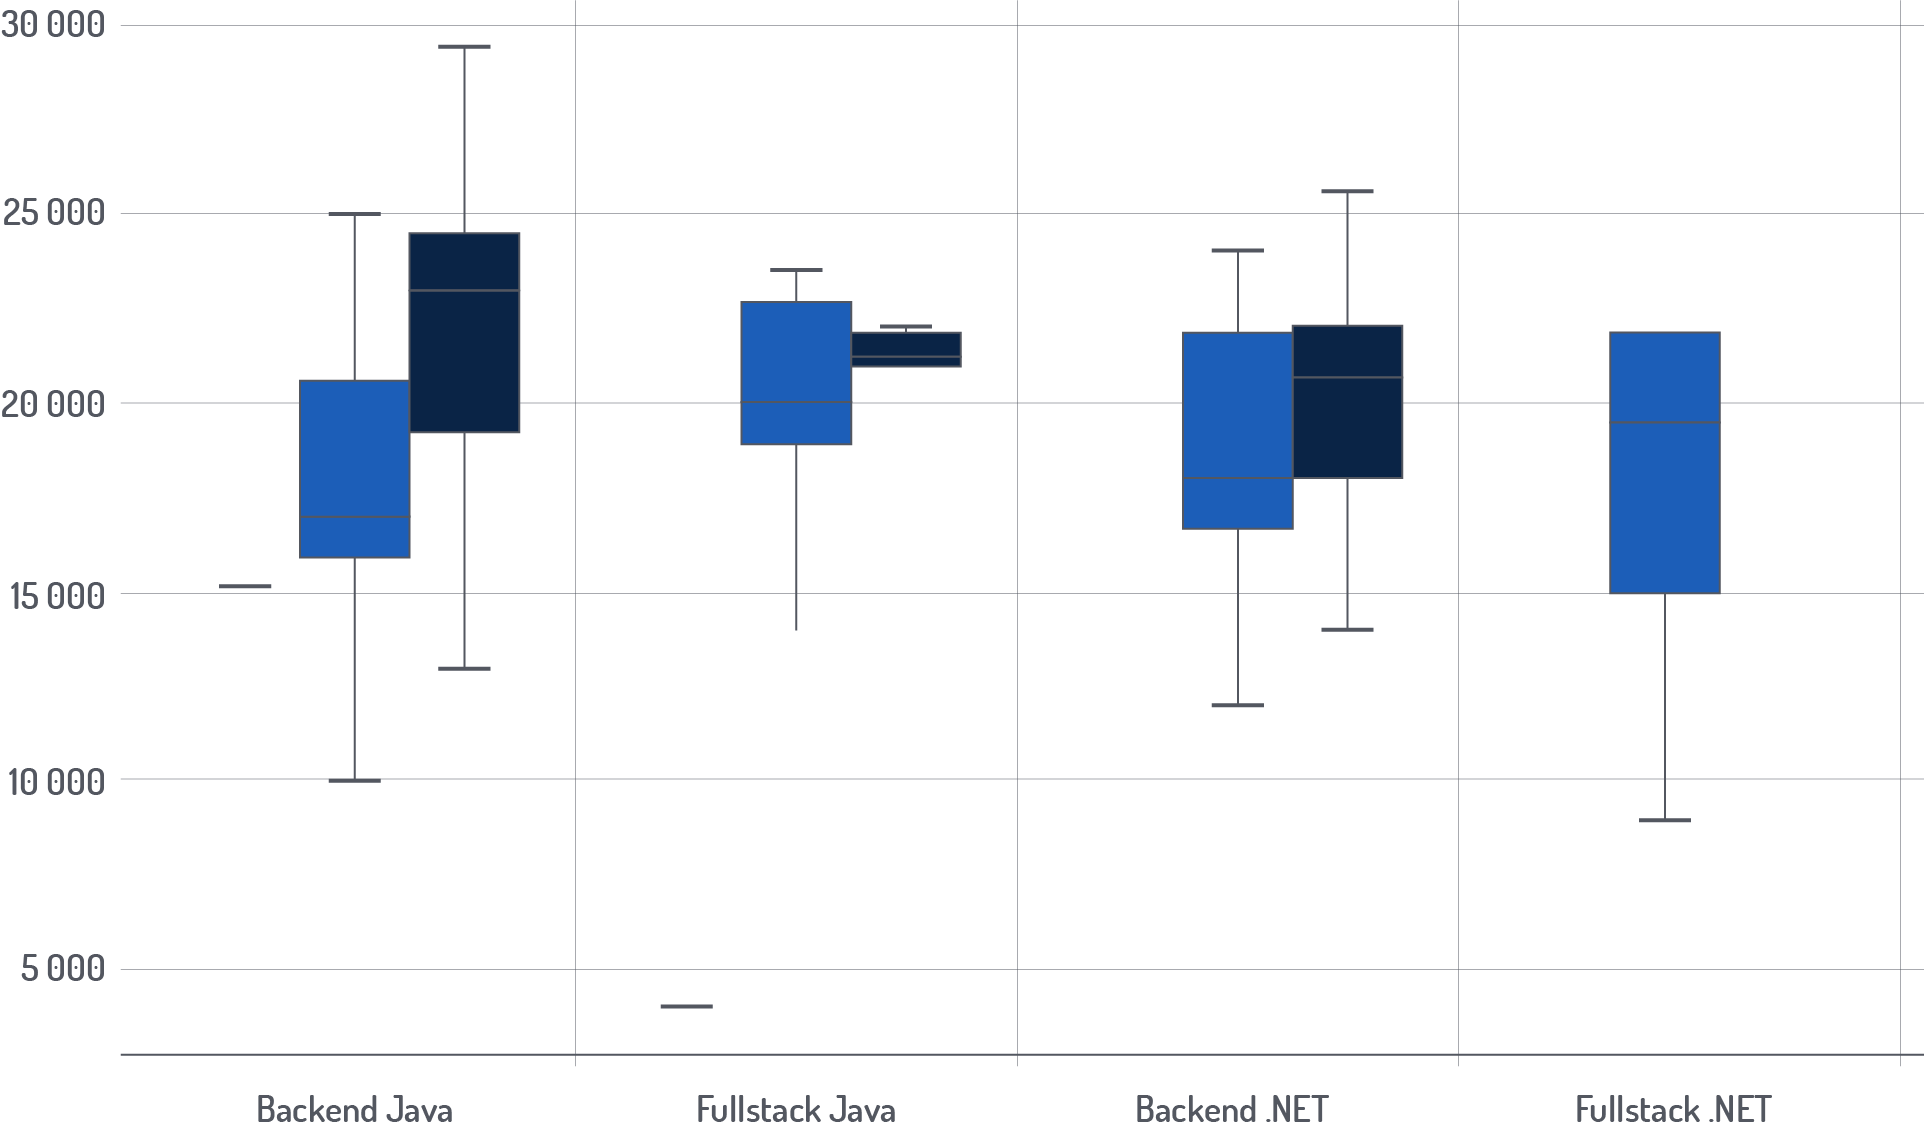
Does company size matter?
Which companies offer higher rates?
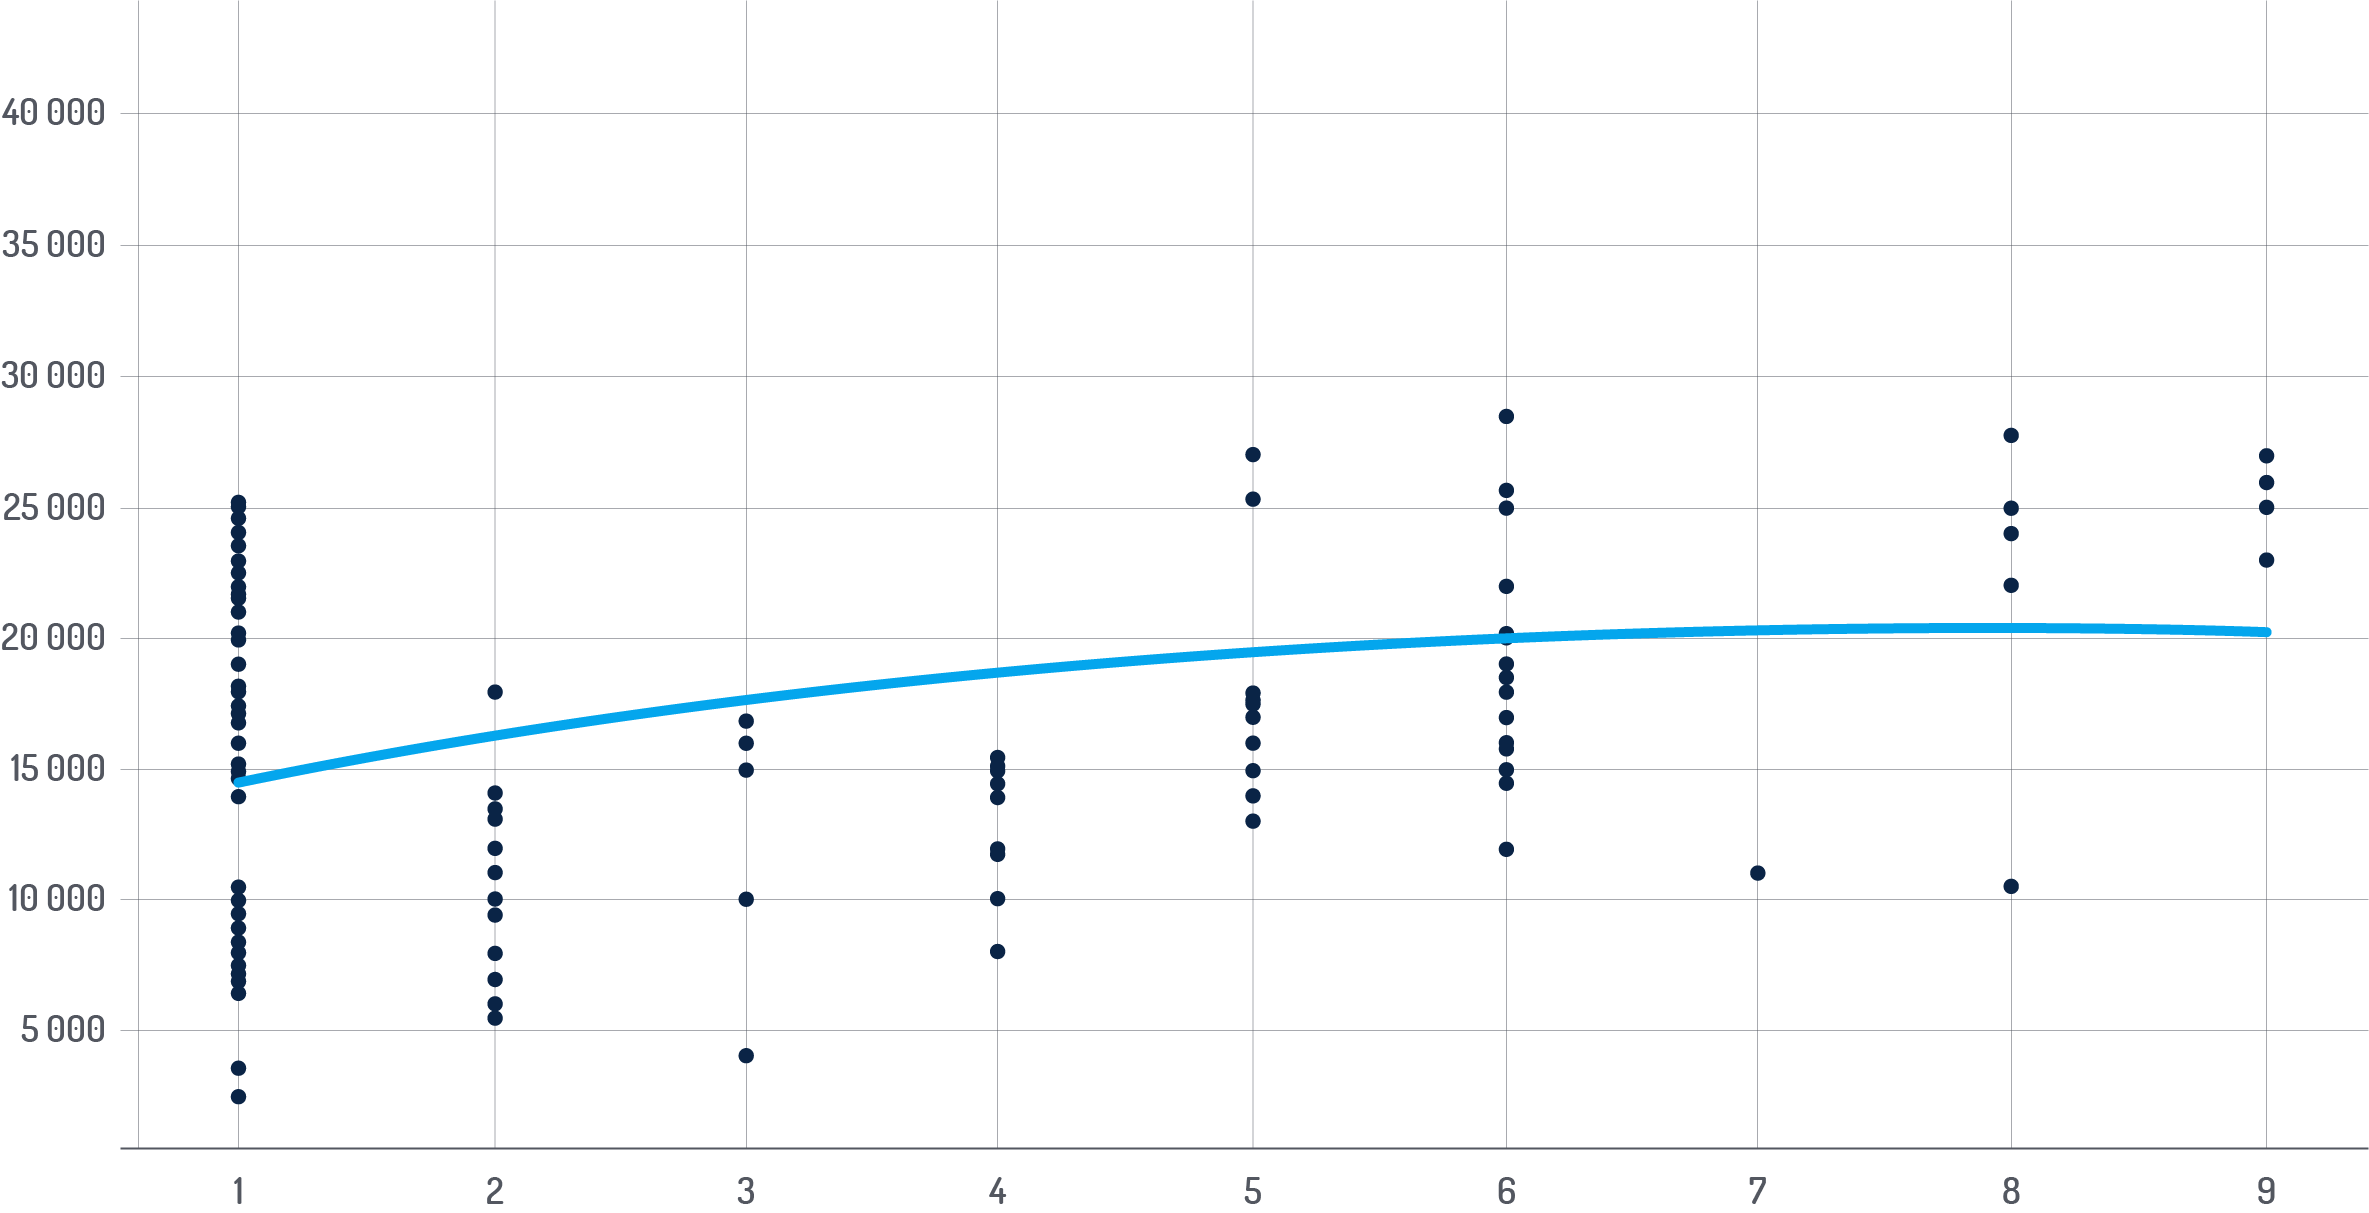
There is a relationship between the rates offered and the size of the company, but it is small. An interesting relationship, however, occurs in the case of the salaries offered and the number of parallel job offers. It turns out that the more companies publish, the more they pay, as illustrated in the chart on the right.
It can be seen that companies publishing job offer versus companies publishing 8 or more job offers simultaneously may differ by as much as PLN 5 000 when it comes to the average upper range. We can still observe an almost complete disappearance of offers with salaries significantly exceeding the market average.
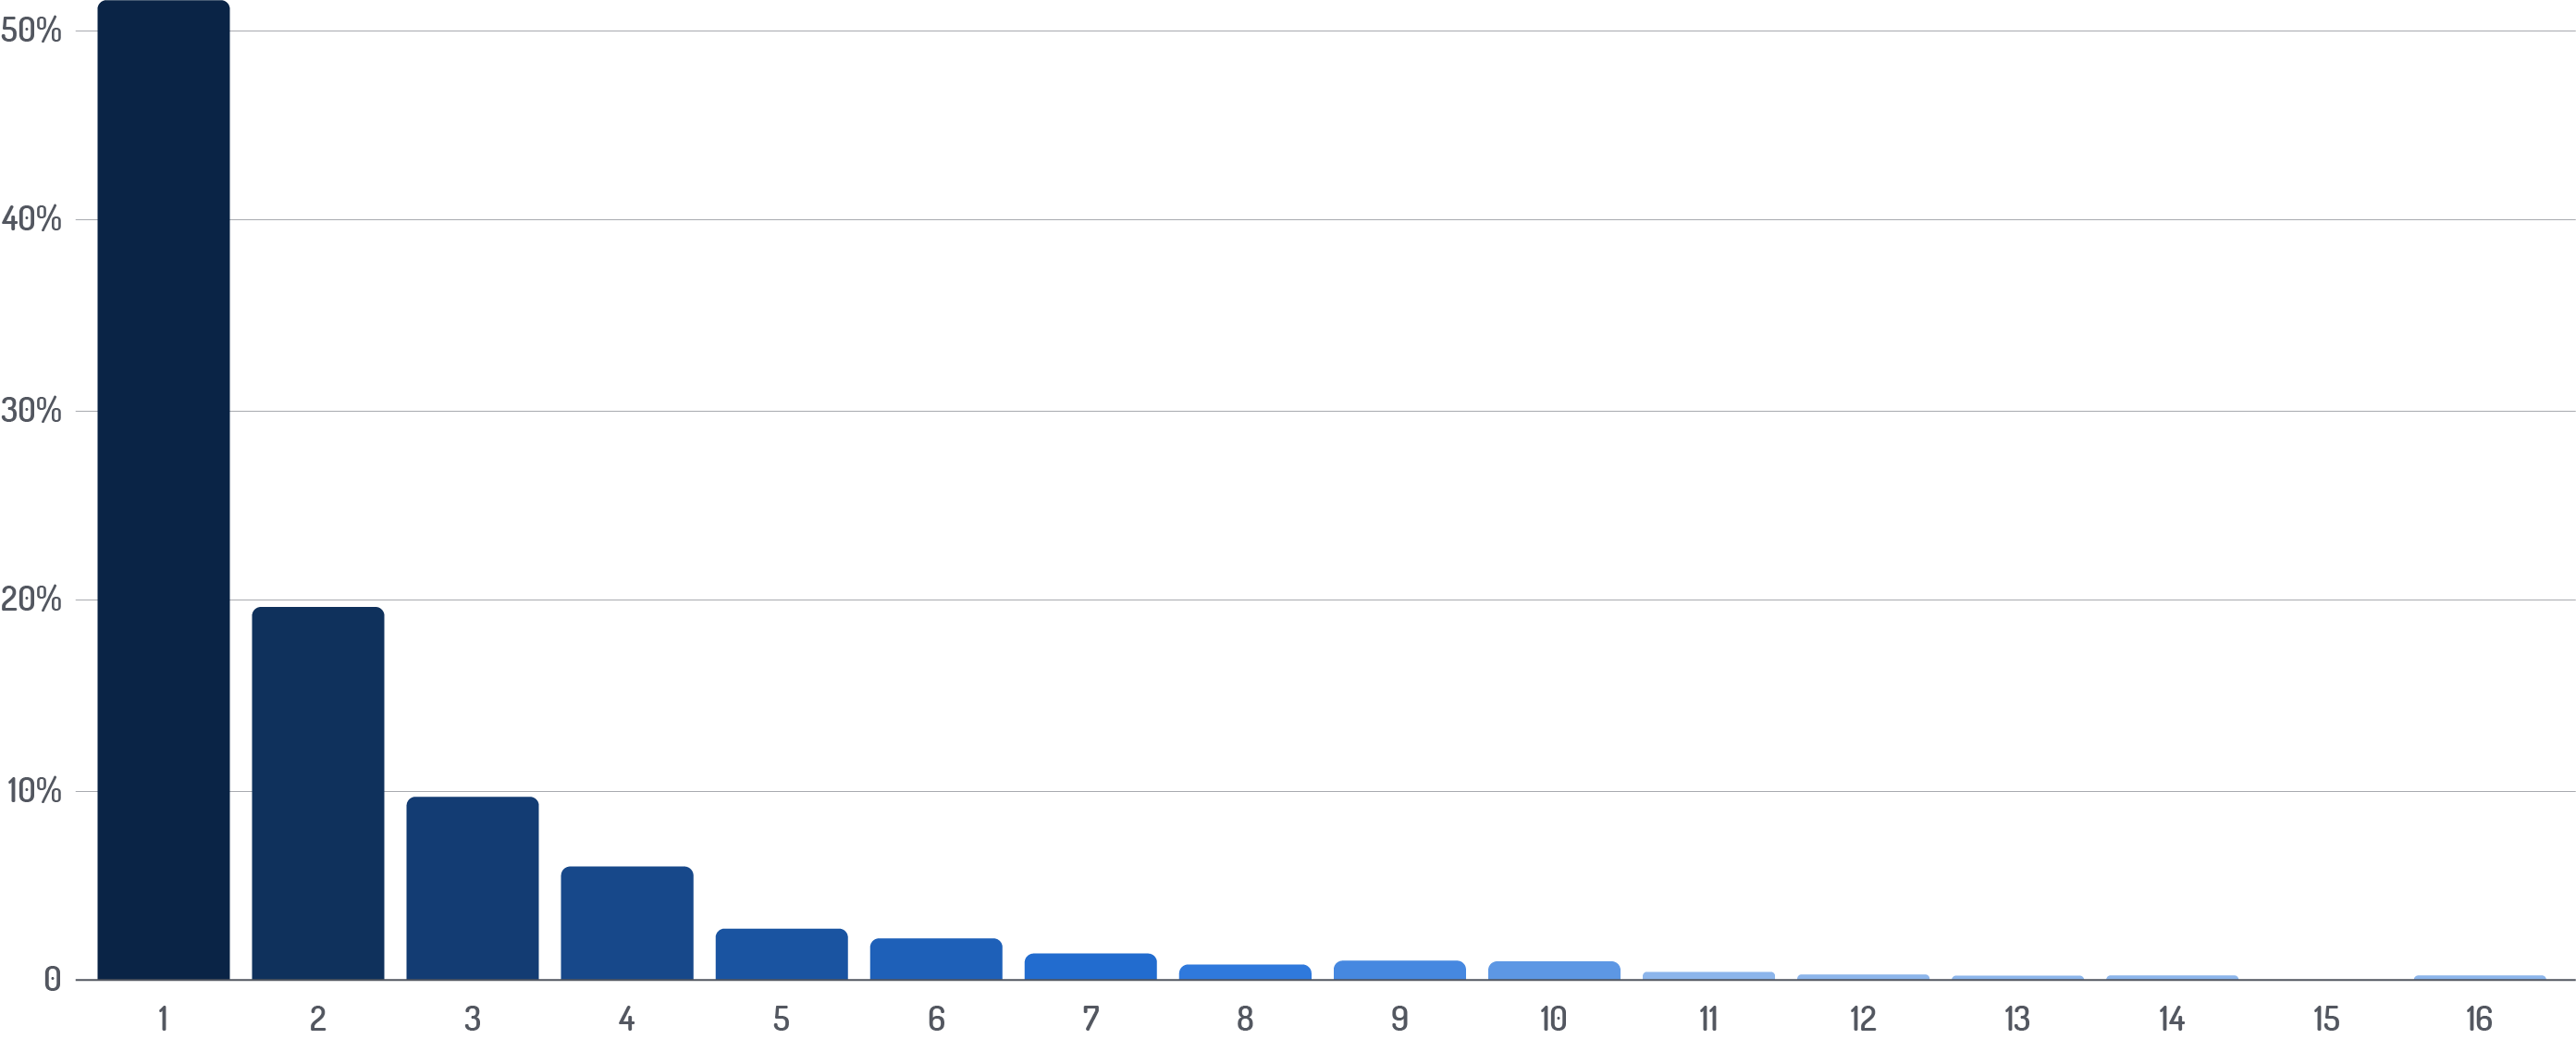
How many job offers are companies posting?
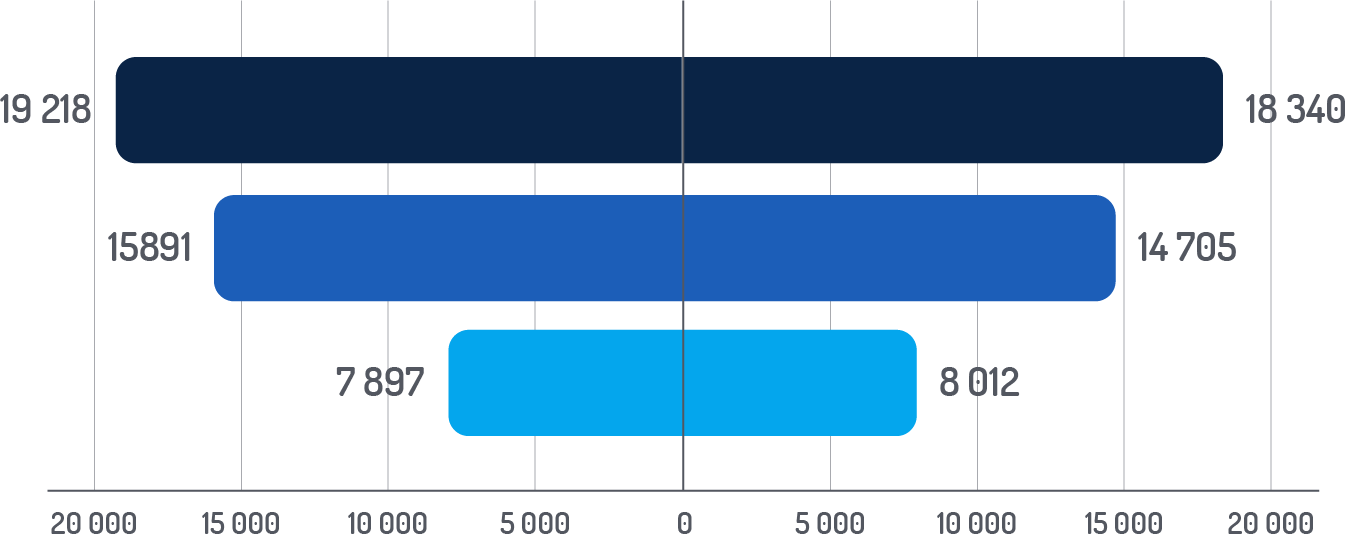
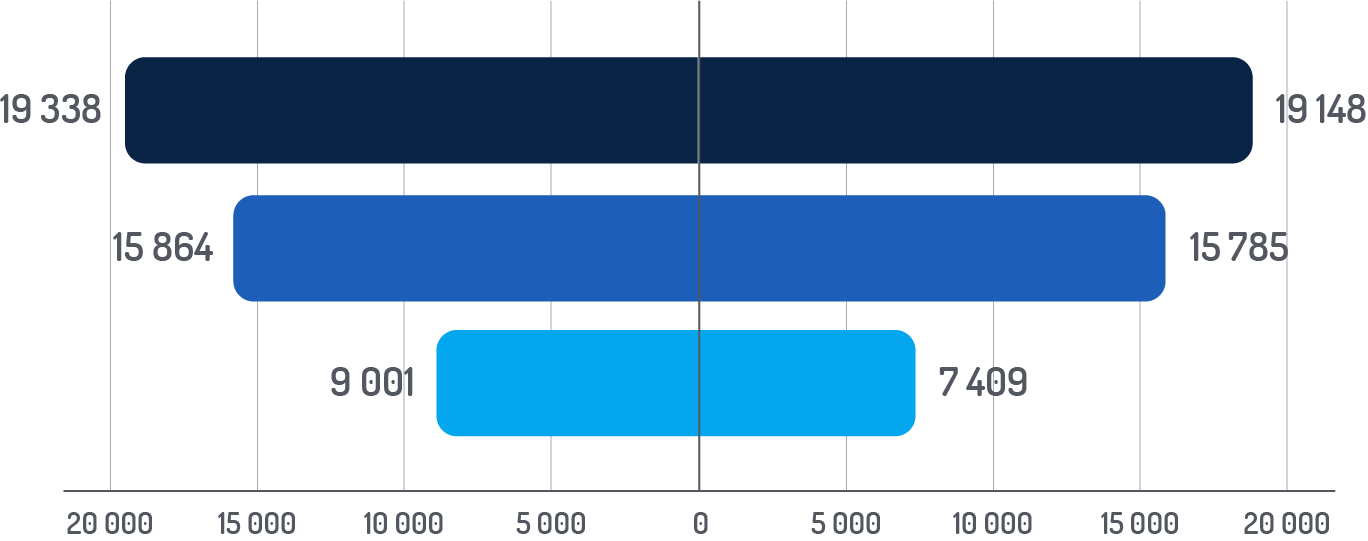
Remote work vs salaries
Comparing to the previous report we can see one difference - rates are back to Q1.
In the case of rates for seniors and mids, there is practically no differences in salary for stationary and remote work.
Wynagrodzenie vs specjalizacja
Android Developers
iOS Developers
DevOps
FrontEnd Developers
Testing Automation / QA
Salaries in cities
Warsaw
Cracow
Poznan
Tricity
Wroclaw
Data Sources
The data comes from:
About the author